Welcome to CHART BOOK
Welcome to CHART BOOK
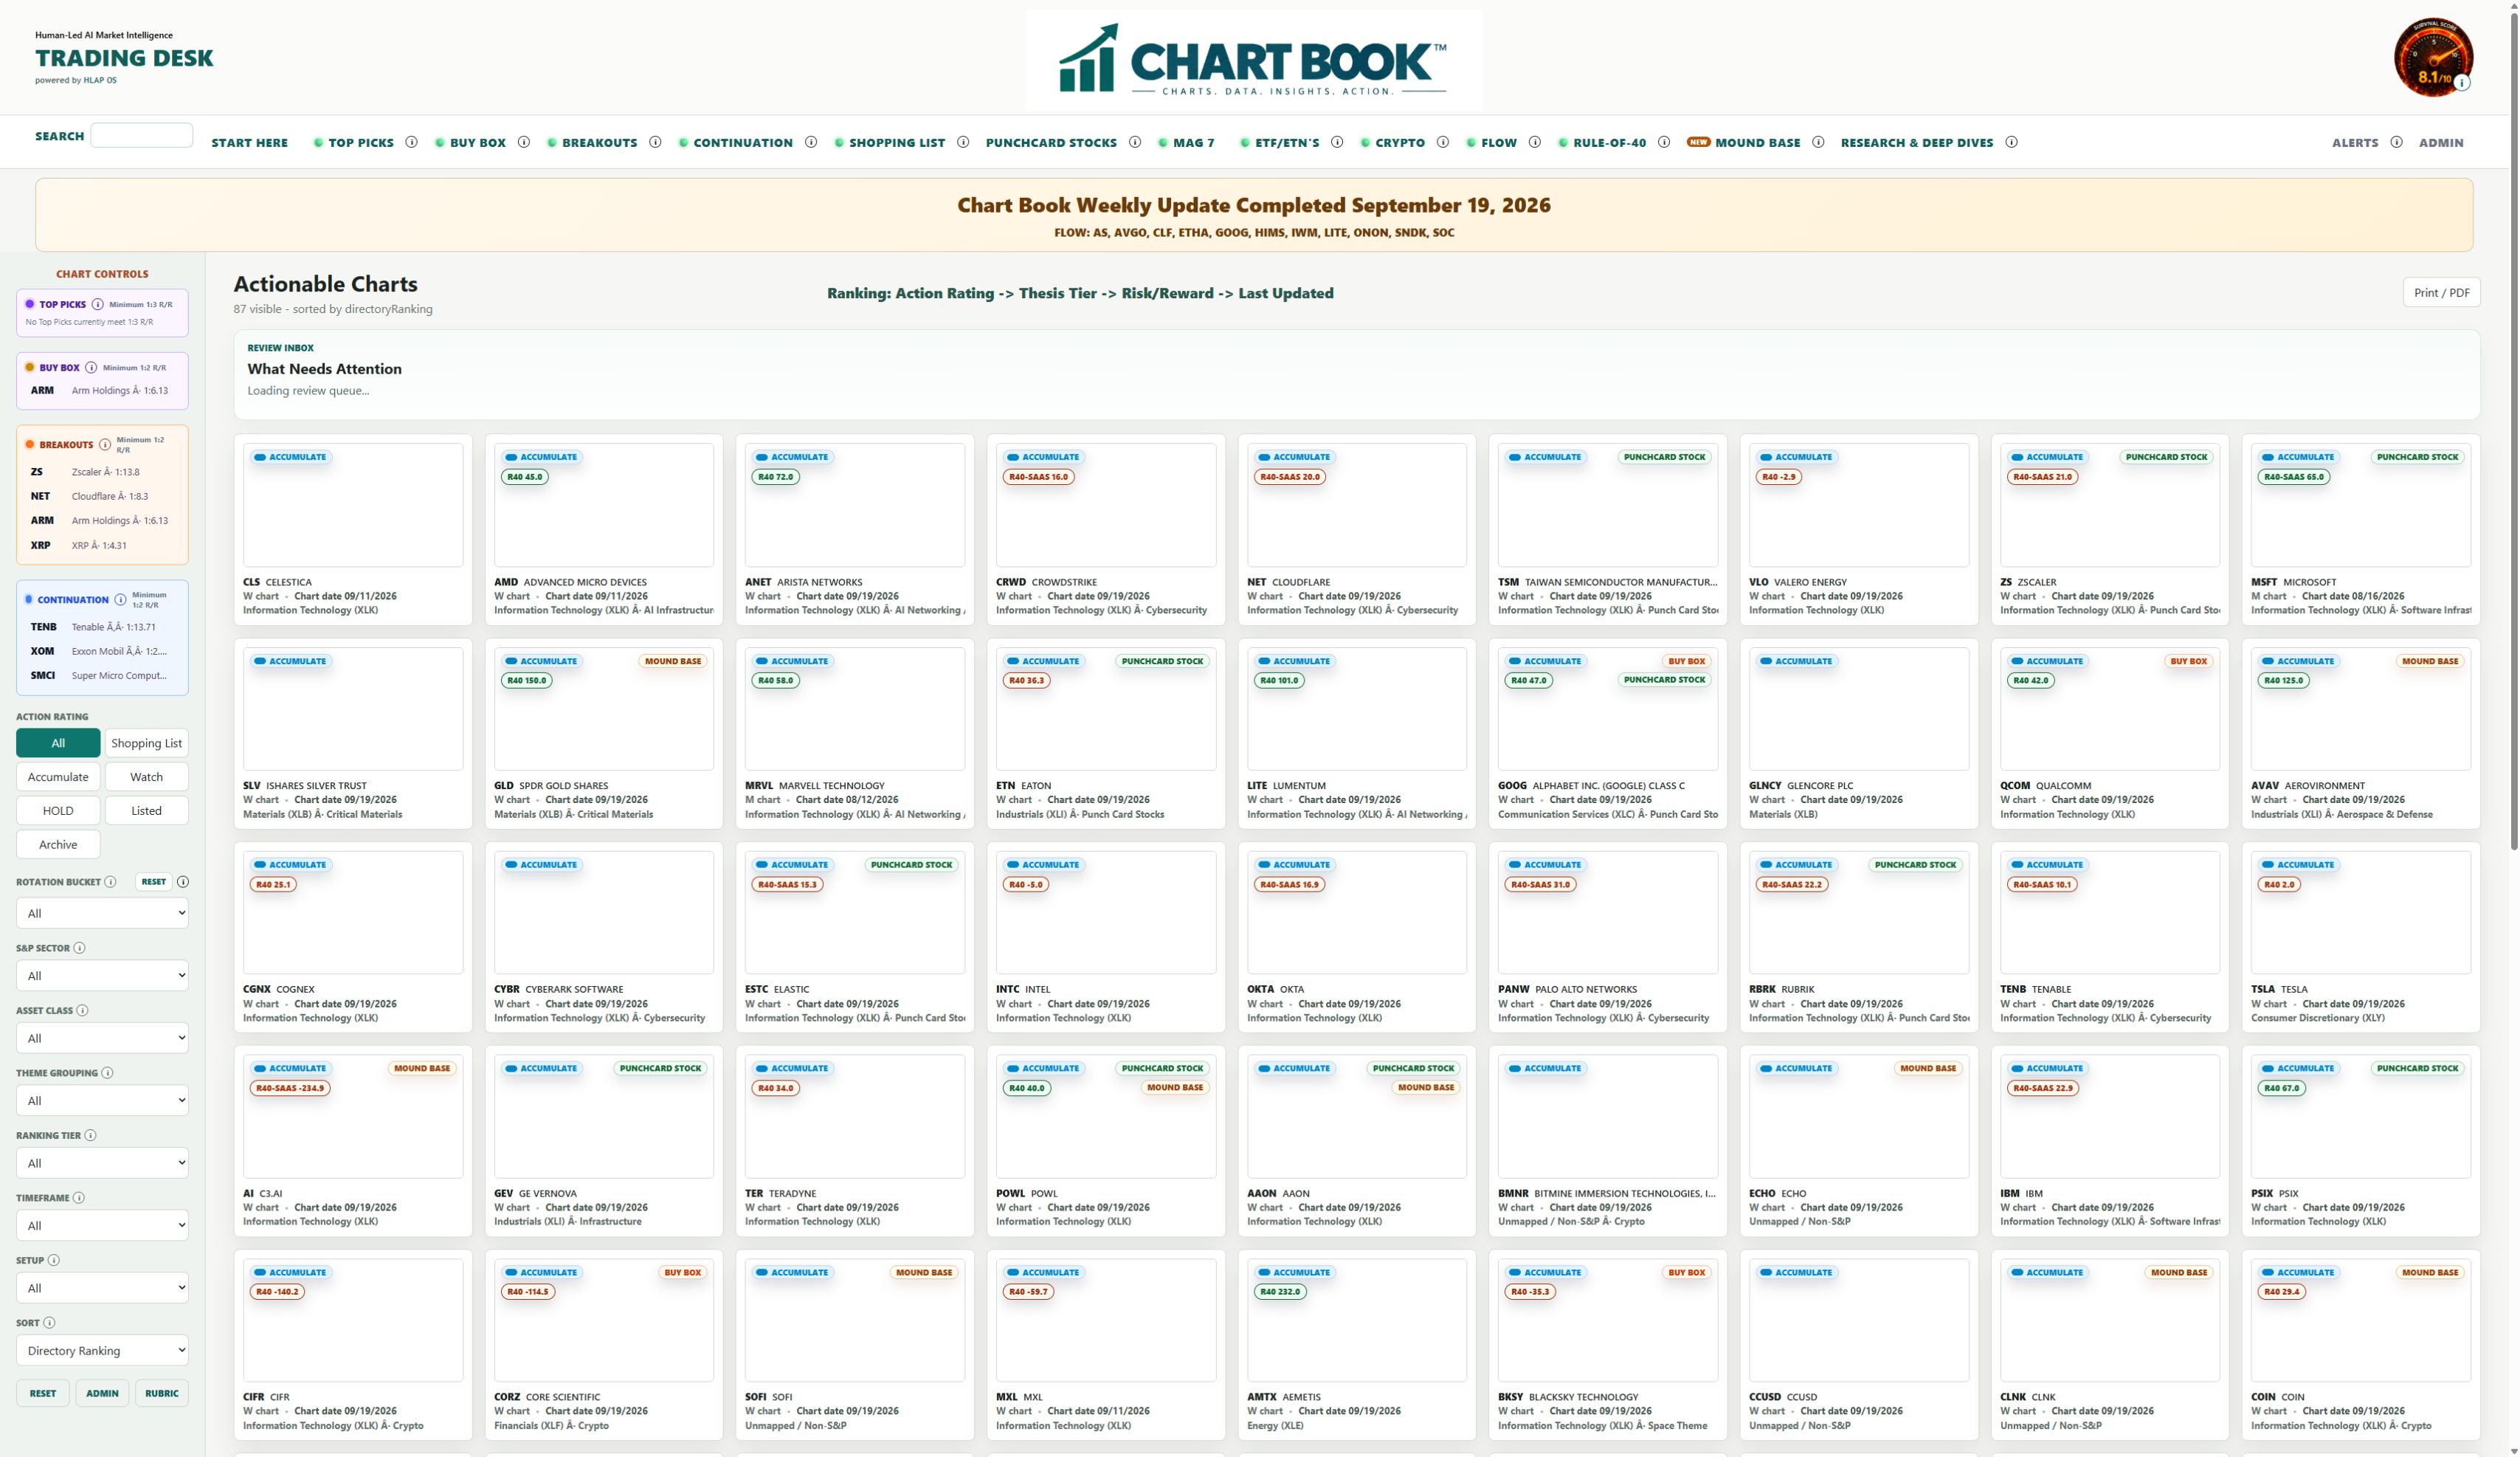
CHART BOOK is a visual investment research platform designed to help investors organize research, evaluate technical structure, and identify opportunities through a consistent process.
It combines technical analysis, market structure, risk management, projected targets, and the underlying investment thesis into one research environment. Instead of switching between multiple charts, watchlists, research notes, and analysis tools, every opportunity is evaluated using the same structured workflow.
An Actionable Chart is a chart that has been organized into the current research desk because its technical structure, company context, or market evidence deserves attention now. Actionable does not mean guaranteed, risk-free, or automatically qualified for entry; it means the chart is important enough to review through the complete technical, risk, reward, and thesis process.
This walkthrough follows the current site: the live navigation, directory tabs, filters, chart detail view, Mound Base reference, research surfaces, alerts, and export tools. Interface labels and available records can change as the weekly research set is refreshed.
CHART BOOK organizes the research.
You make the final investment decision.
How CHART BOOK Thinks
Every investment idea is evaluated using the same sequence:
- Technical Structure
- Risk
- Risk / Reward
- Targets
- Thesis
Beginning with the technical evidence before reading the company story creates a more disciplined and consistent investment process.
The company may be outstanding.
The technical picture determines whether today offers an attractive opportunity.
Your Daily Workflow
Your Daily Workflow

This is the current daily starting screen: the left-side cards provide fast review queues, while the top tabs open broader classified directories. Begin with the queue that matches the question you are asking, then open the underlying chart before making a judgment.
A productive review begins with focus, establishes risk, and only then considers the upside.
Start here each day:
- Open Top Picks to begin with the strongest current research ideas.
- Review Buy Box for opportunities near more attractive decision areas.
- Open one company and read its technical story.
- Find the risk levels before considering the reward.
- Decide whether the potential return justifies the planned risk.
- Review T-1, T-2, and T-3.
- Read the Thesis to understand why the company deserves attention.
- Move directly to the next opportunity.
This routine keeps every decision grounded in the same evidence. Start with price. Then earn the right to believe the story.
Current Site Map
The top navigation is the map of the research desk. It separates fast decision queues, structural directories, company research, and event monitoring.
- Start Here explains the complete workflow.
- Top Picks, Buy Box, Breakouts, Continuation, and Shopping List organize the current opportunity set by decision purpose.
- Punchcard Stocks, MAG 7, Pharma-Bio, ETF/ETN's, Crypto, FLOW, and Rule-of-40 provide focused research directories.
- Mound Base is a separate structural directory for explicit Valid Mound Base evidence.
- Research & Deep Dives provides the longer business and thematic story.
- Alerts surfaces technical-event monitoring.
Important: A directory label is research classification. It is not automatically a buy instruction, an entry trigger, or proof that the risk/reward gate has been met.
Understanding the Collections
Understanding the Collections
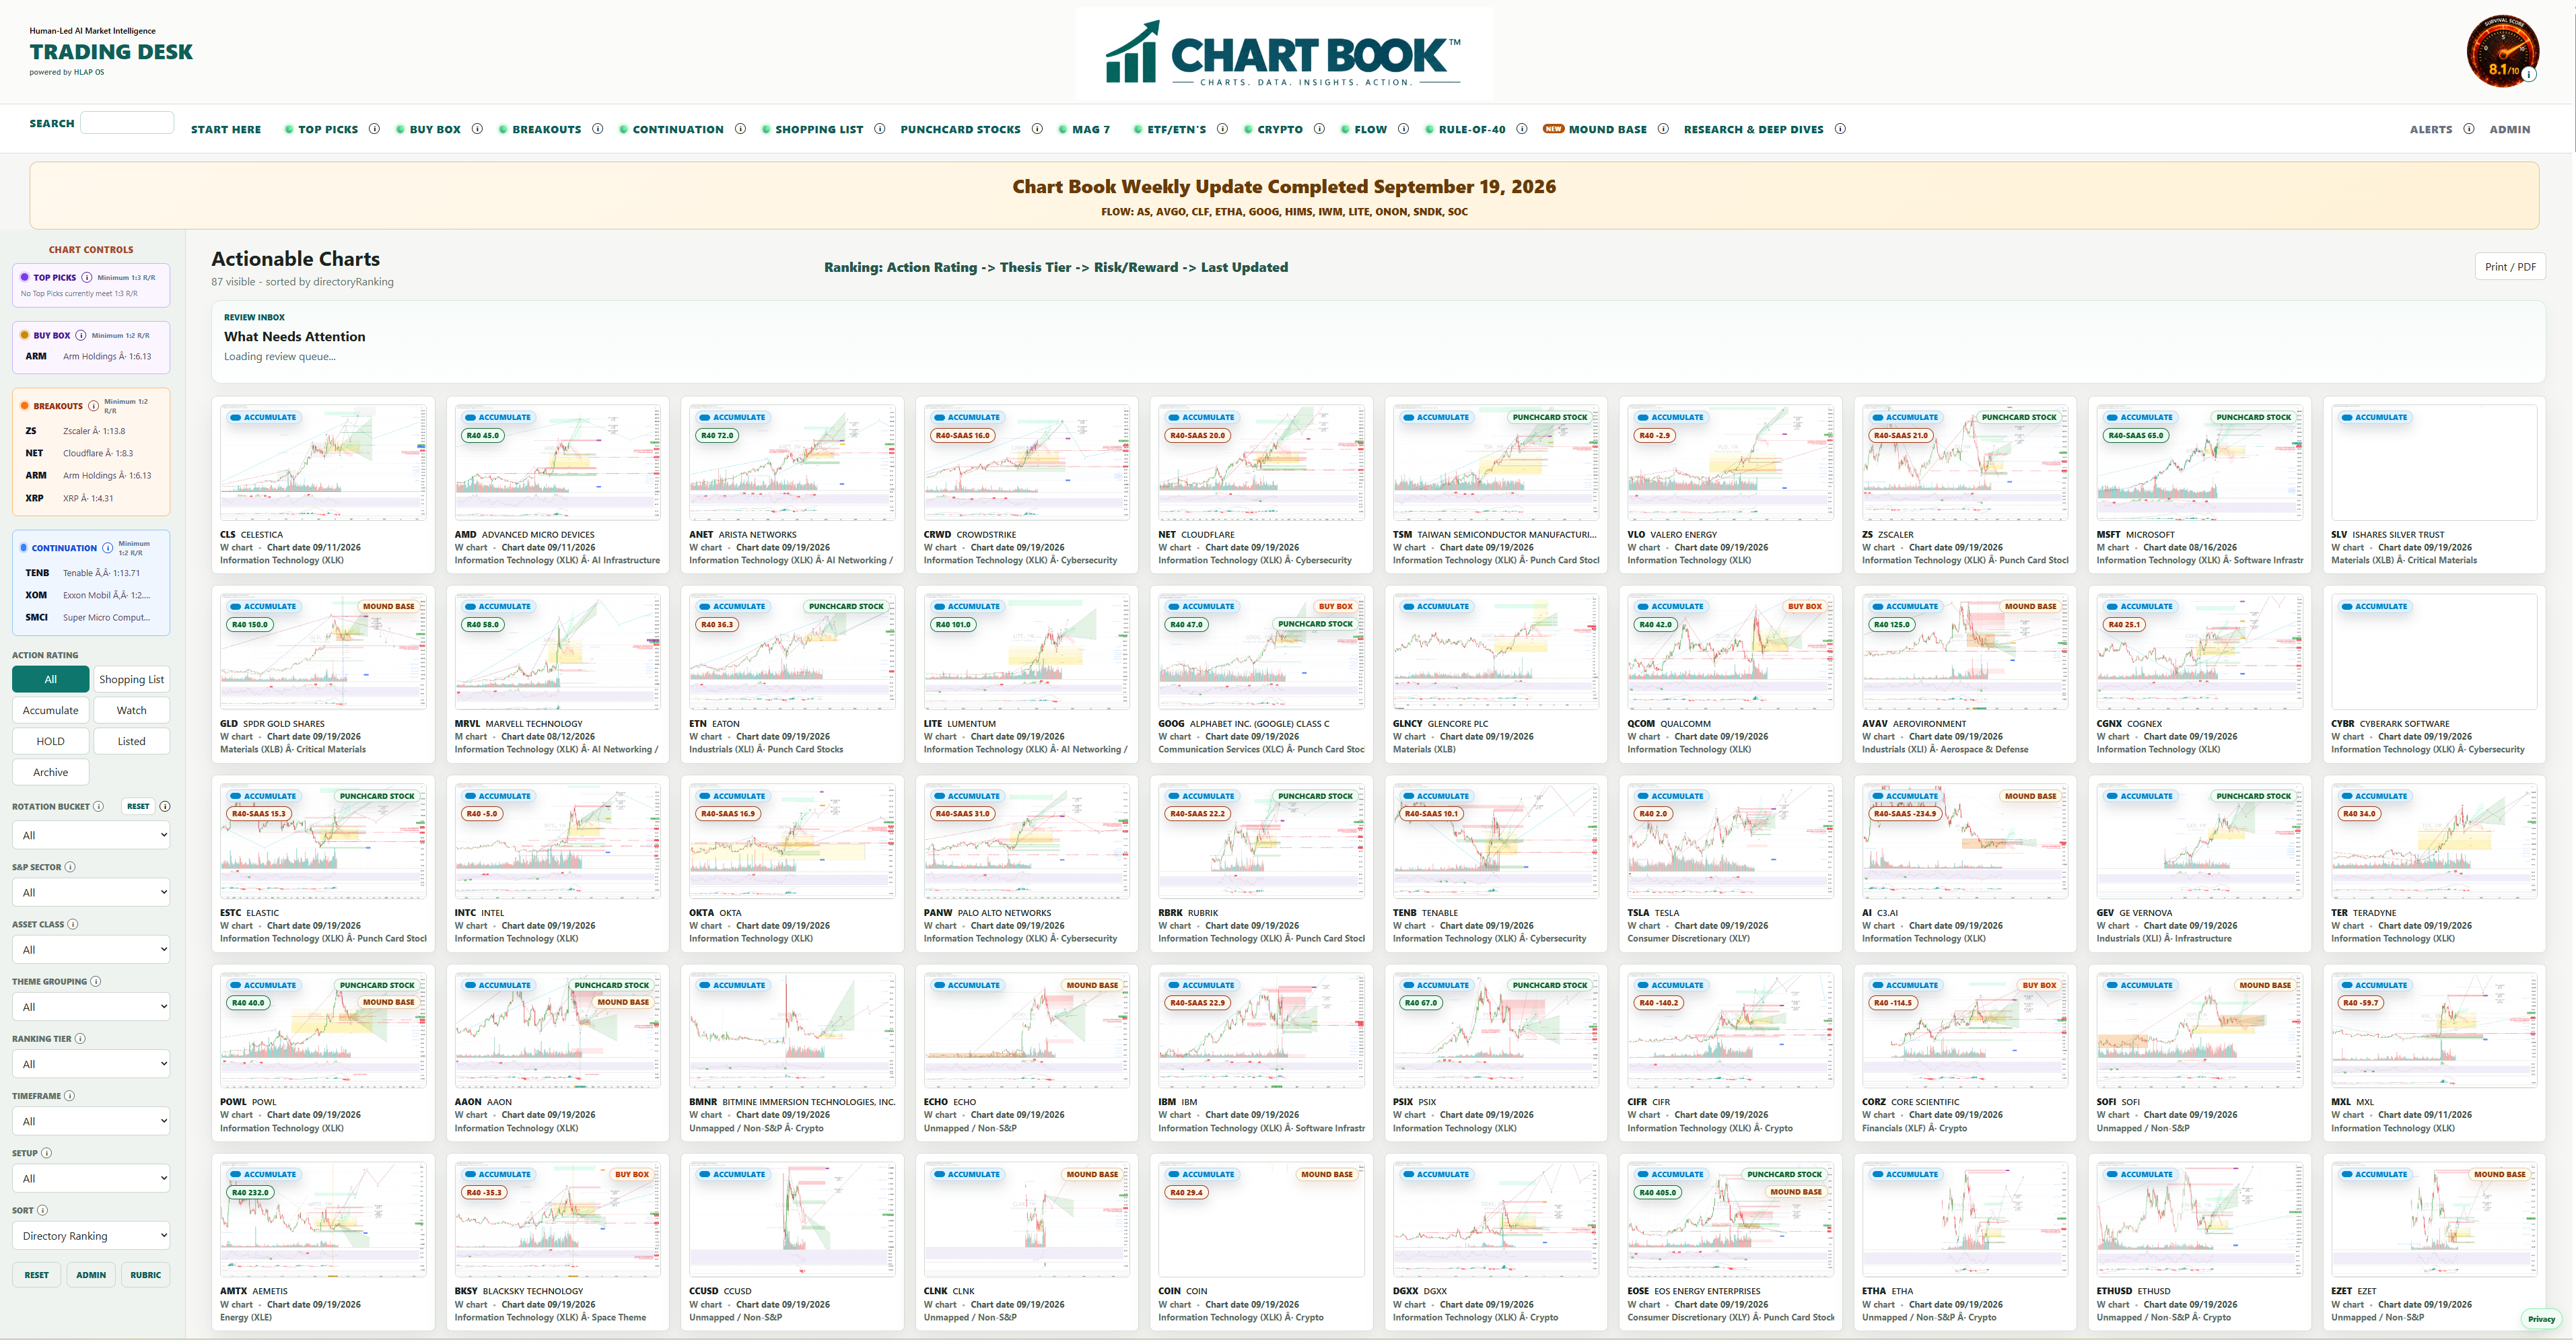
Collections organize research by purpose instead of ticker.
Each one gives you a different starting point depending on the question you want to answer.
Two layers organize the home screen: the cards on the left are quick-review panels for priority queues such as Top Picks, Buy Box, Breakouts, and Continuation; the tabs across the top are broader directory scans such as Crypto, FLOW, Rule-of-40, and Mound Base.
The top directory tabs are comprehensive scans of the available stock and instrument universe for that classification. They do not automatically apply the risk/reward qualification condition used by the focused setup lists. A chart can therefore appear in a directory because it has the relevant classification or evidence even when entry, stop, target, or minimum risk/reward data is incomplete. That does not mean the chart will not work; many may work. It means the user must open the chart and complete the risk and confirmation review before treating it as a qualified setup.
TOP PICKS
TOP PICKS

Top Picks represent the highest-conviction research ideas currently in CHART BOOK.
Use this collection to begin with the strongest combination of company quality, technical structure, and potential reward. Every opportunity should still be evaluated using its trigger, risk levels, and risk/reward before an investment decision is made.
Starter Suggested
Starter Quick LinkStarter Suggested
Starter Suggested highlights developing opportunities where a small beginning position may fit the current evidence.
These setups have a defined trigger and risk plan, with more confirmation still ahead. An empty Starter list simply means patience is the best current choice.
Buy Box
BUY BOX

The Buy Box identifies a price area where the balance between risk and potential reward becomes more attractive.
Use it to focus your entry review. The trigger, stop, and risk/reward determine whether the opportunity qualifies.
Shopping List
SHOPPING LIST

The Shopping List keeps strong companies close while you wait for better price, structure, or confirmation.
It turns patience into a repeatable process. The research remains ready when the setup improves.
Punchcard Stocks
PUNCHCARD STOCKS

Punchcard Stocks are businesses worth understanding across a larger investment cycle.
Use this collection to develop conviction before the ideal entry appears. Long-term quality and disciplined timing work together.
MAG 7
MAG 7 DIRECTORY

The MAG 7 directory groups the market's largest technology and platform leaders into one focused review.
Use it to compare leadership, technical health, and market influence across Apple, Microsoft, Alphabet, Amazon, Meta, Nvidia, and Tesla. These companies often affect the major indexes and broader risk appetite, but each chart still keeps its own Action Rating, risk levels, targets, and thesis.
Pharma-Bio
NEW DIRECTORYPHARMA-BIO

Pharma-Bio groups pharmaceutical, biotechnology, and TechBio companies into one focused research directory. It helps separate businesses whose central value proposition depends on therapeutics, drug discovery, clinical development, or biological platforms from the broader stock universe.
This is a classification and research starting point, not a claim that a company has an approved medicine, a successful clinical result, or a qualified entry. Review development stage, catalysts, regulatory risk, technical structure, invalidation, and reward-to-risk for each name.
ETFs
ETF DIRECTORY

The ETFs directory brings the covered exchange-traded funds into one focused workspace.
Use it to compare broad-market, sector, thematic, commodity, defensive, and tactical exposures without mixing them into the operating-company review. USO and other covered funds remain eligible for their separate Action Rating, Buy Box, Top Pick, or Breakout classifications.
Rule of 40
RULE-OF-40 RANKINGS

The Rule-of-40 directory compares growth with profitability using one screening score:
Rule-of-40 score = latest-quarter year-over-year revenue growth + trailing-twelve-month profit margin.
CHART BOOK prefers free-cash-flow margin and uses EBITDA margin as a fallback. A score of 40 or higher clears the traditional threshold; a negative margin reduces the score.
- R40-SaaS identifies software, cloud, cybersecurity, and subscription businesses.
- R40-RR identifies other durable recurring-revenue businesses.
- R40 keeps the score visible for companies outside those two comparison groups without forcing a misleading label.
The directory ranks the highest score first. Equal scores are ordered by the All-Domains Thesis research tier: Tier 1, Tier 2, Tier 3, then Unranked. Rule of 40 measures financial balance; it does not measure valuation, chart timing, or whether a stock should be purchased.
Breakouts
Current DirectoryBREAKOUTS

Breakouts track charts attempting to escape a defined resistance, range, base, or other technical structure. The directory identifies research candidates; the chart still needs a valid trigger, risk plan, and acceptable reward relative to risk.
Continuation
Current DirectoryCONTINUATION

Continuation tracks established trends that may be pausing, pulling back constructively, or preparing for another leg. It is different from a fresh breakout and should be evaluated for support, momentum, and re-entry quality.
Crypto
Current DirectoryCRYPTO

Crypto includes digital assets and publicly traded instruments materially tied to the digital-asset ecosystem. Treat the asset class, timeframe, liquidity, and technical risk as part of the review rather than assuming stock-market behavior applies unchanged.
FLOW
Current DirectoryFLOW

FLOW is the current rotation and participation workspace. Use it to see where the weekly research process is detecting relevant movement, then open the underlying chart and read its actual structure and risk plan.
Mound Base
Current DirectoryMOUND BASE

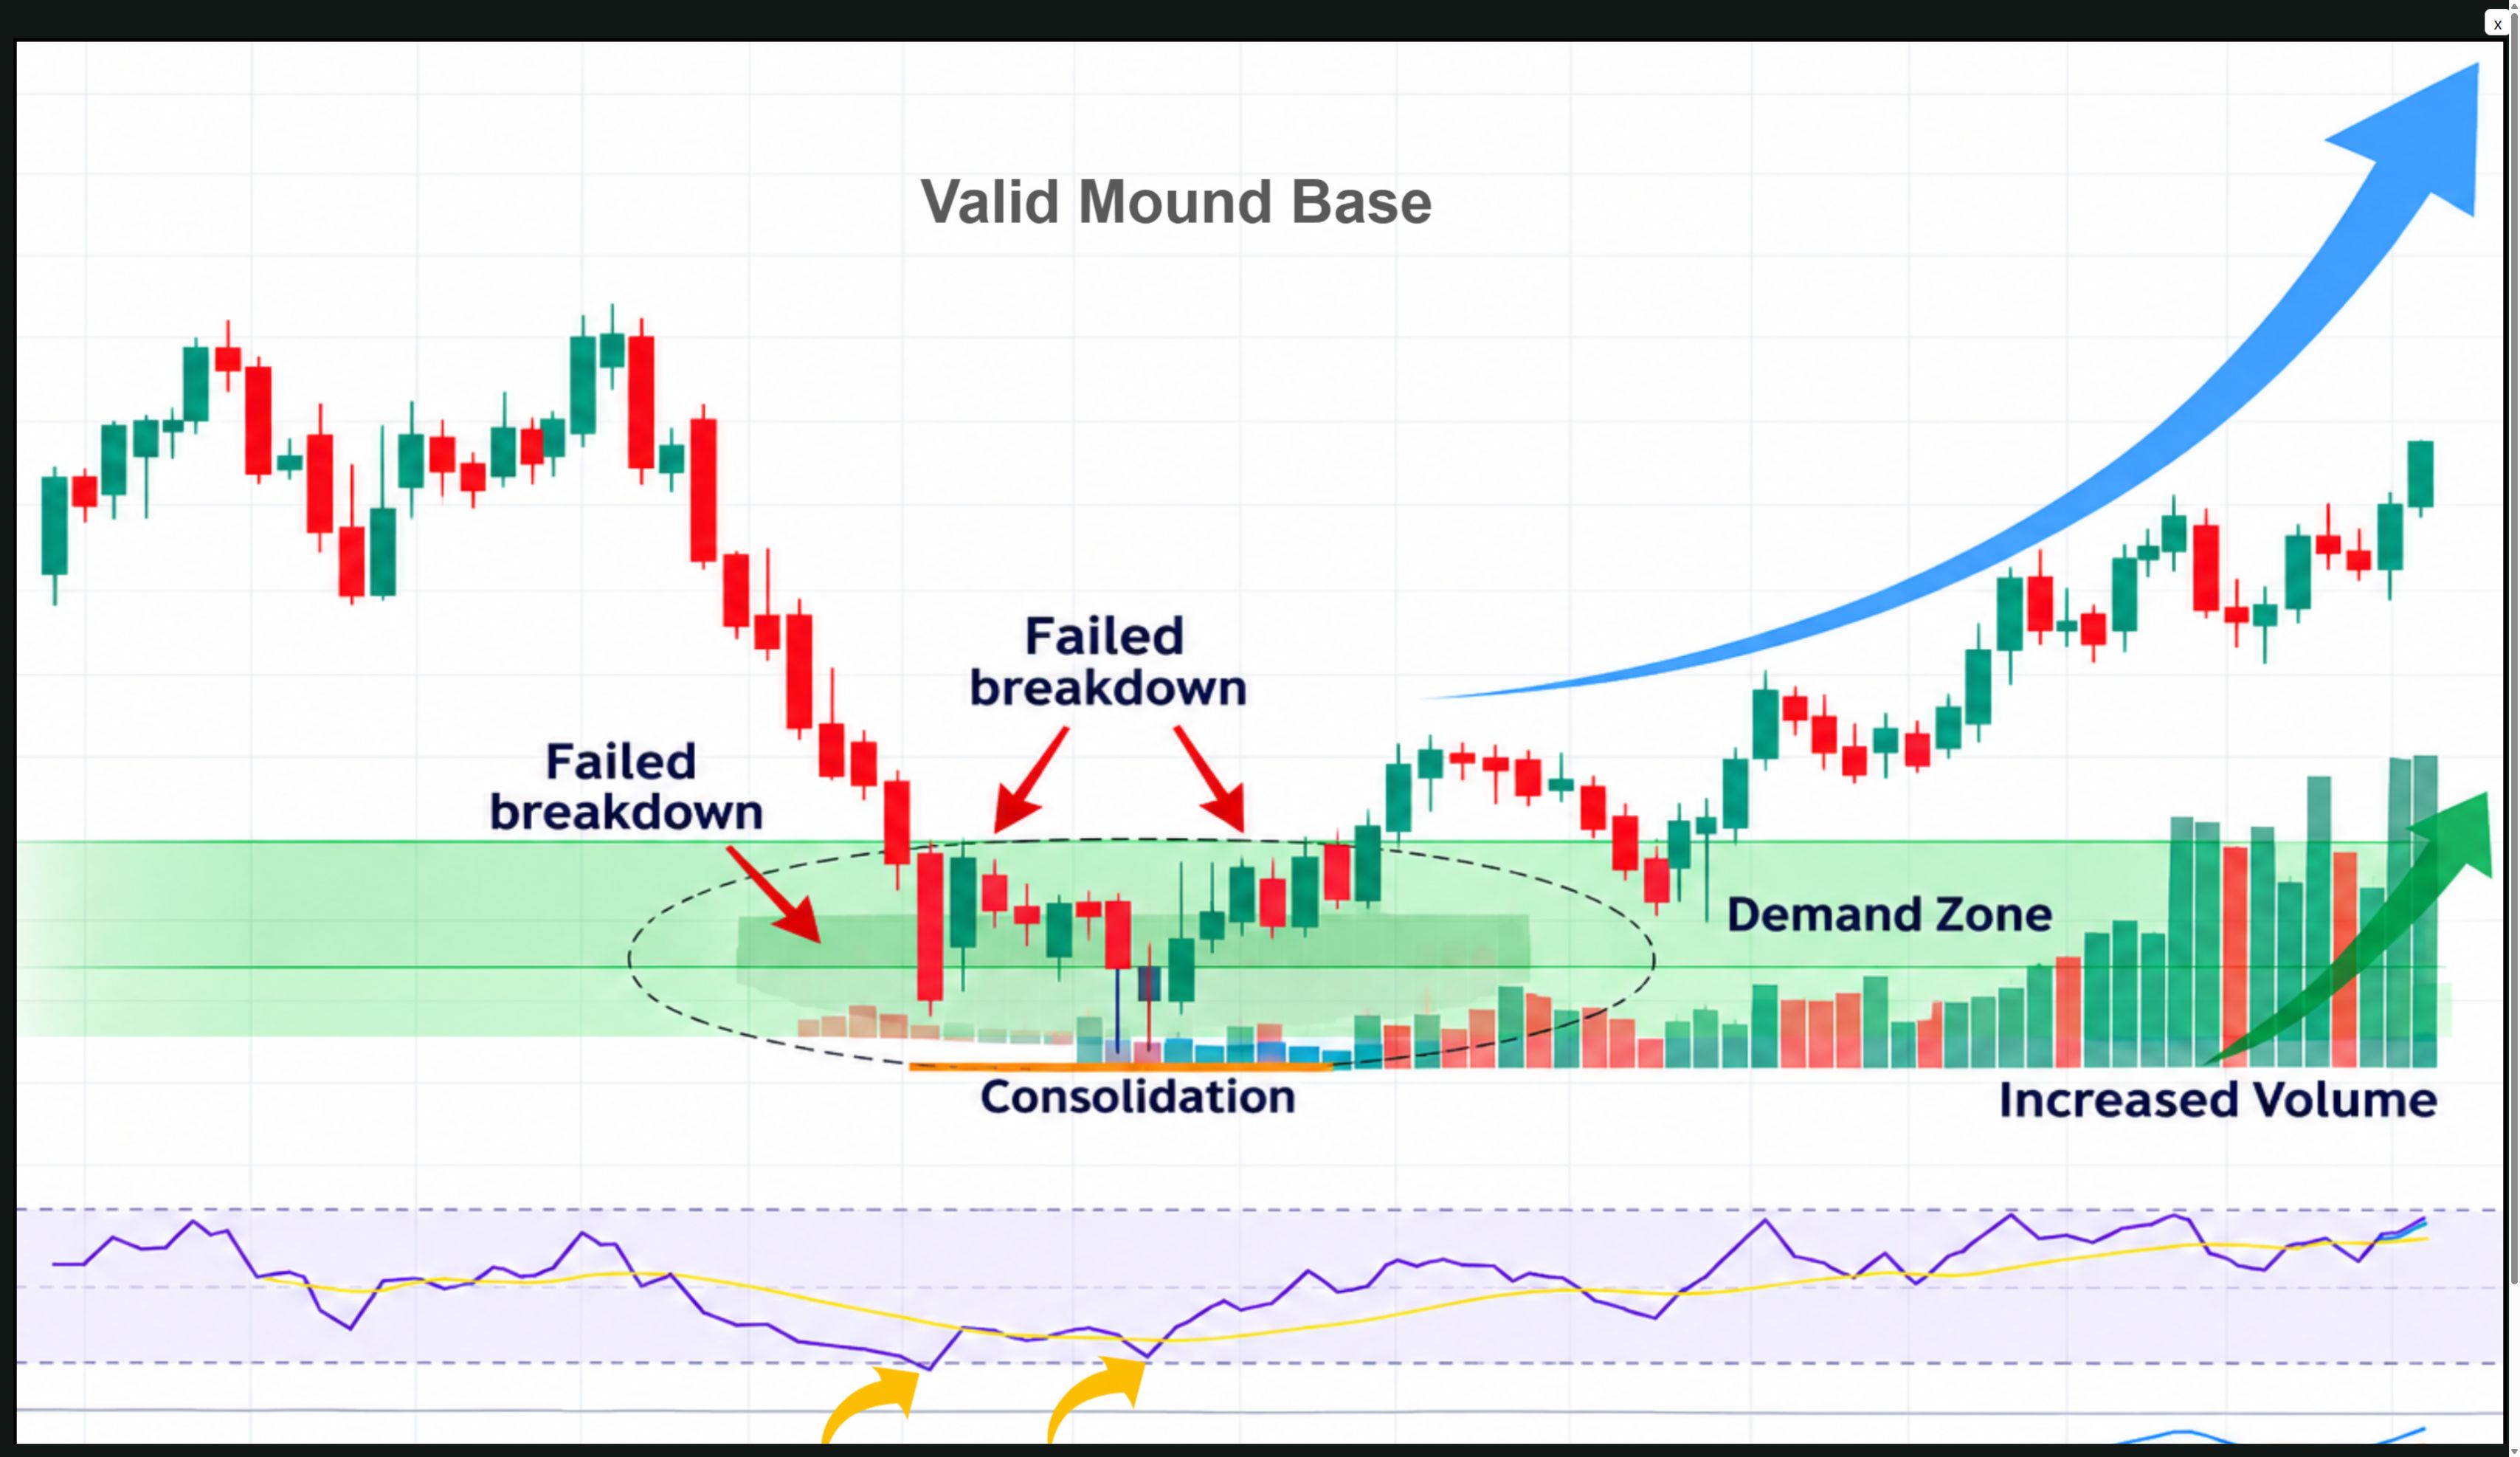
Mound Base is a structural directory for records with explicit Valid Mound Base evidence. It does not mean the chart is currently inside a BUY BOX or that an entry trigger has been confirmed.
The first card is a reference diagram rather than a ticker record. Select it to study the complete structure, including failed breakdowns, consolidation, demand, volume, RSI, and divergence.
Research & Deep Dives
RESEARCH & DEEP DIVES

Research & Deep Dives provide the most detailed research layer in CHART BOOK, combining Research Reports, Deep Dives, and Special Reports.
Use this section when a standard company report is not enough. It can examine the business model, competitive position, industry structure, catalysts, risks, financial evidence, regulatory context, and long-duration thesis in greater depth. The technical chart still governs timing and risk; the research strengthens understanding of what may drive the opportunity. Use the small i description beside the tab when you need the section definition.
Understanding Action Ratings
Understanding Action Ratings
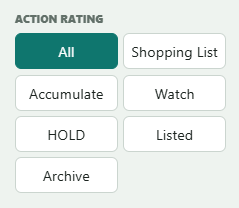
Action Ratings show where each opportunity stands in the research process.
They help direct attention toward the ideas that matter most today.
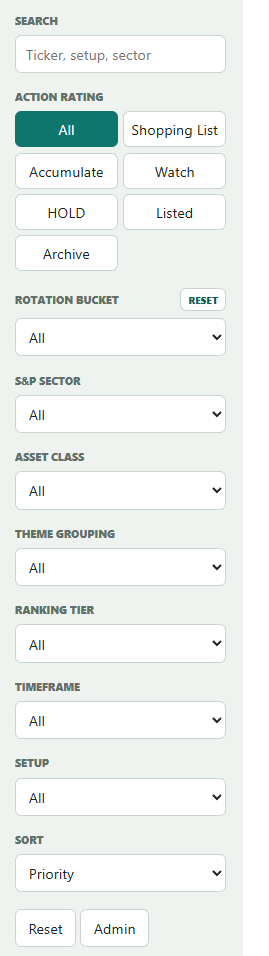
ACTION RATING FILTER: Use All, Shopping List, Accumulate, Watch, HOLD, Listed, or Archive to narrow the visible chart directory. The selected rating changes the research view; it does not change the underlying chart record.
Listed
Listed companies belong in the research universe and remain available for future review.
Use this rating to preserve awareness without crowding the daily decision list.
Watch
Watch identifies opportunities approaching an important technical decision point.
This is where preparation becomes valuable: know the trigger, risk levels, and preferred entry area before conditions change.
Accumulate
Accumulate identifies a constructive area where building a position can be evaluated under a defined risk plan.
The setup still earns its place through confirmation and an acceptable risk/reward ratio.
Hold
Hold means the original investment thesis and technical structure remain intact.
Use the existing risk plan to judge whether the opportunity continues to behave as expected.
Trim
Trim highlights conditions where reward has compressed, price has become extended, or technical risk is increasing.
It prompts a fresh review of exposure, gains, and the remaining upside.
Archive
Archive preserves completed, replaced, or inactive research outside the daily workspace.
The history remains available without competing with current opportunities.
Reading the Technical Story
Reading the Technical Story
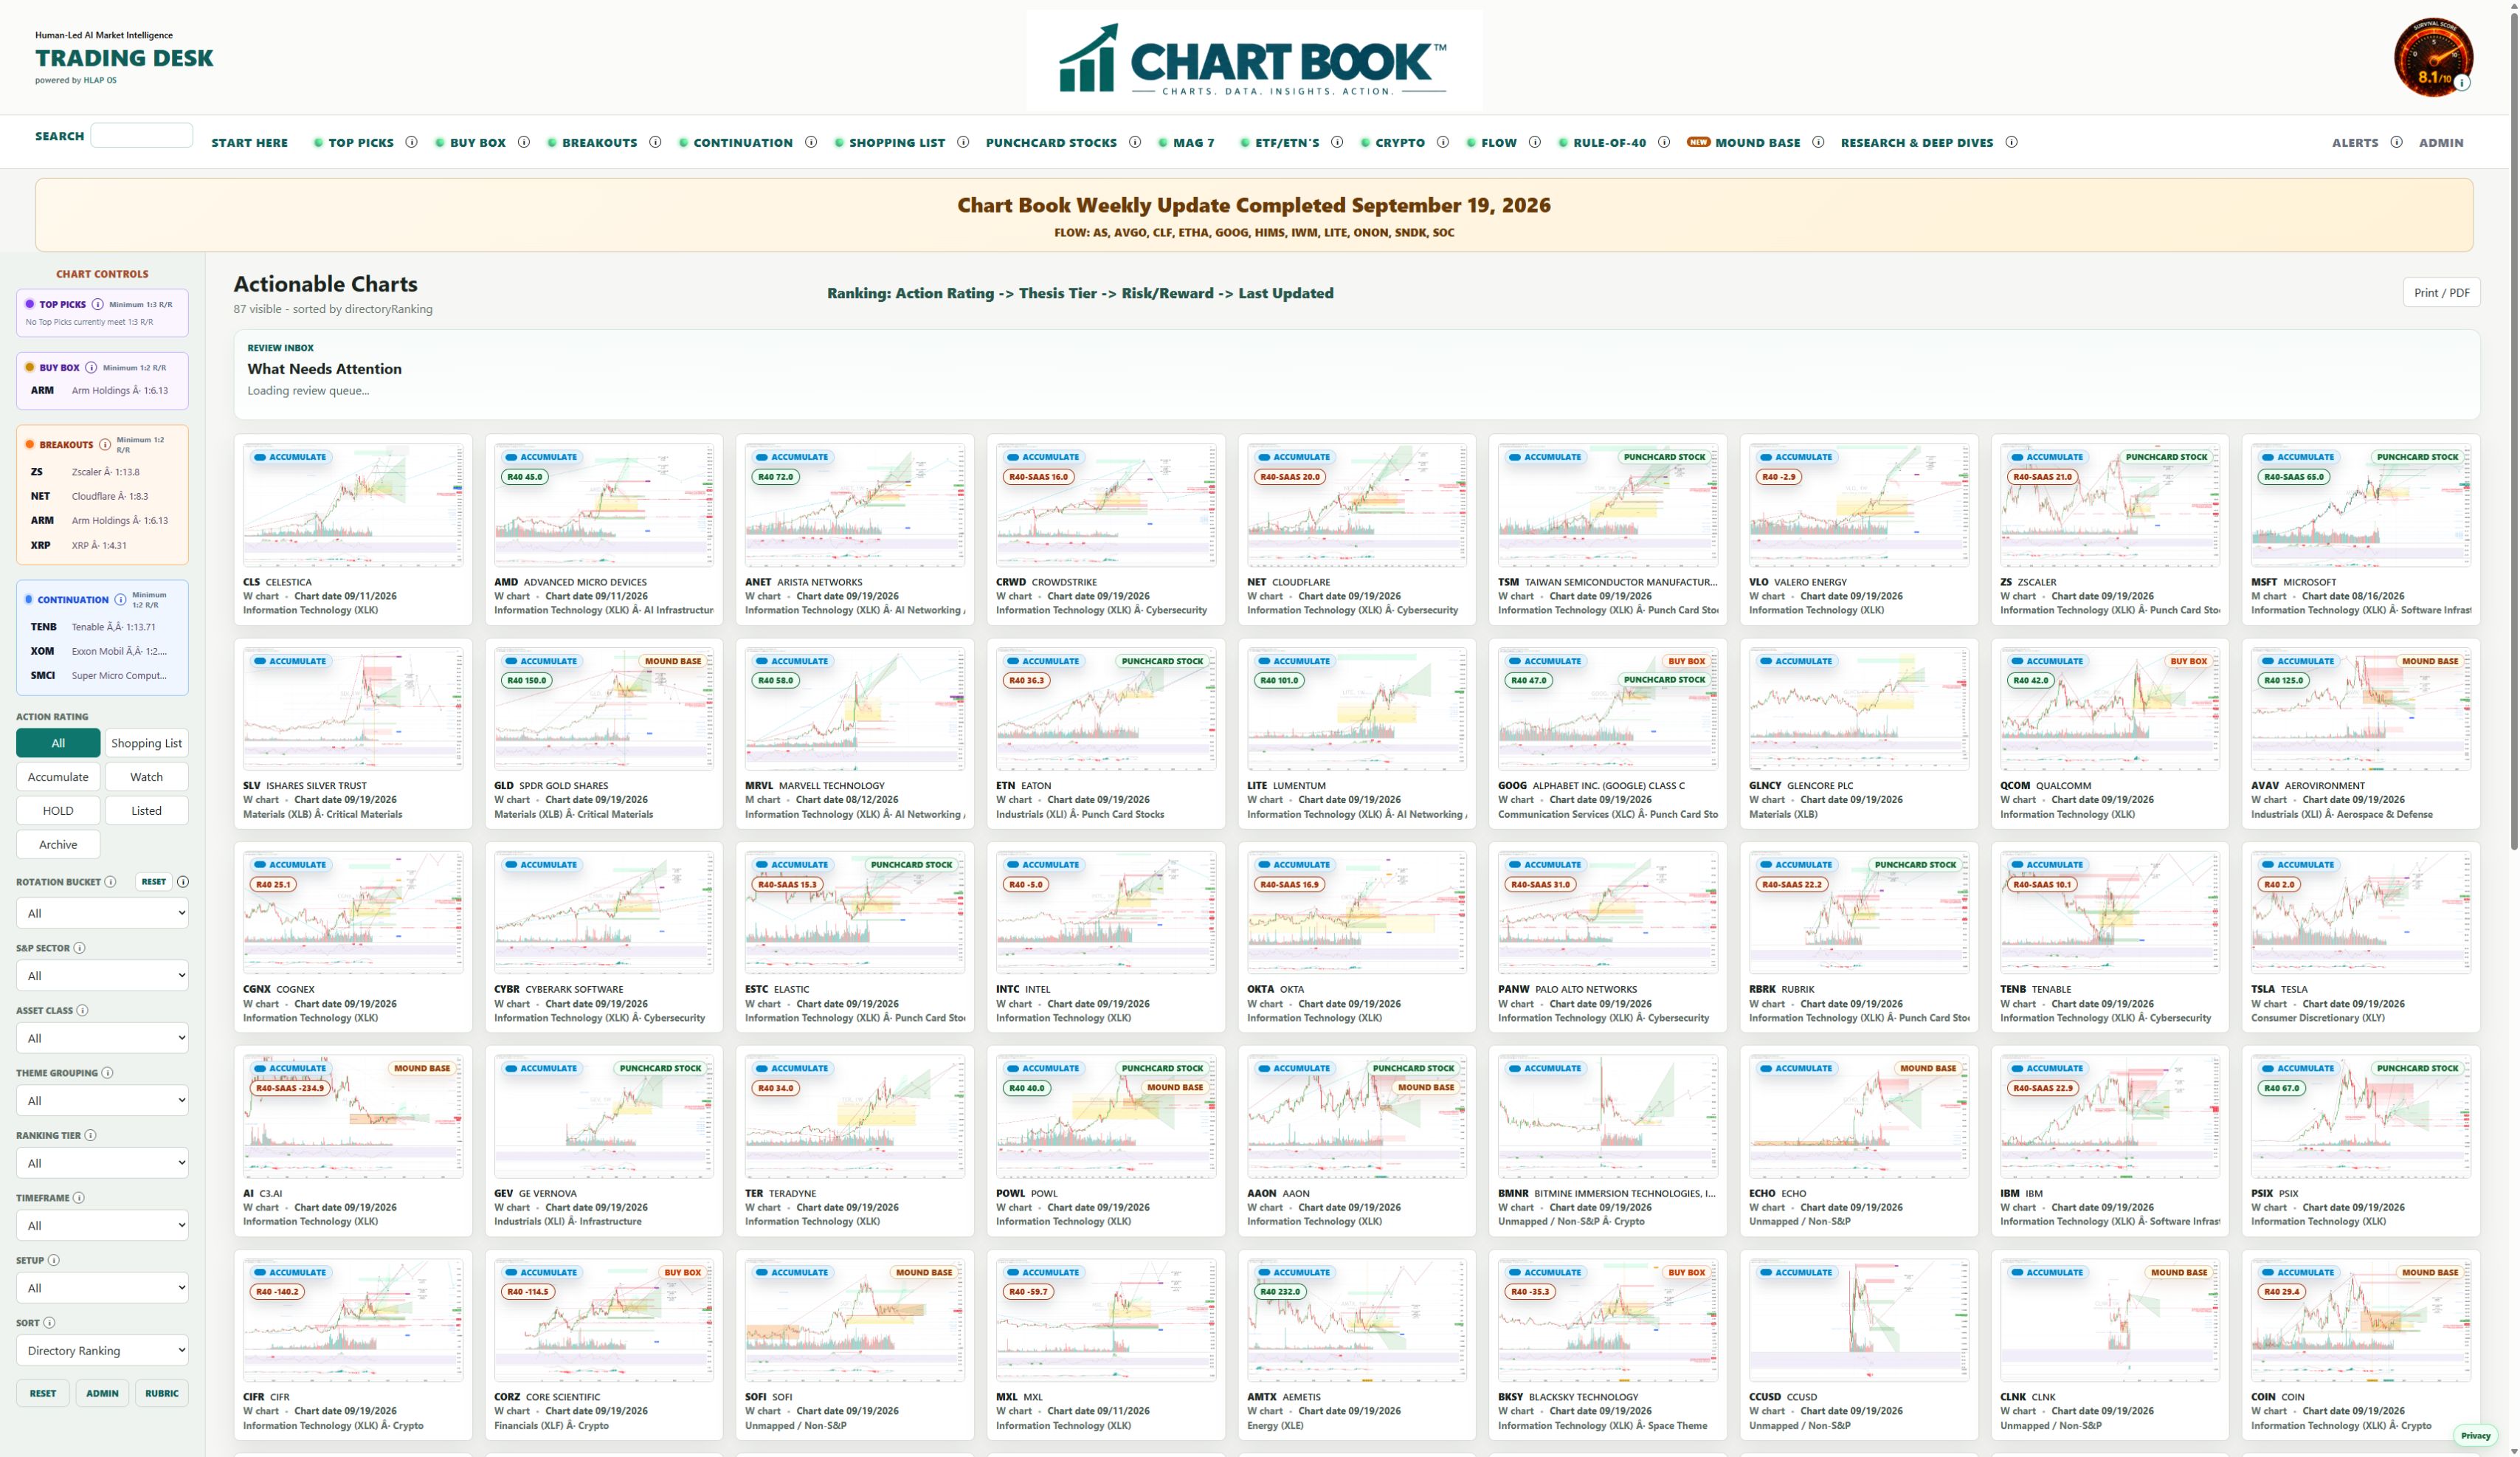
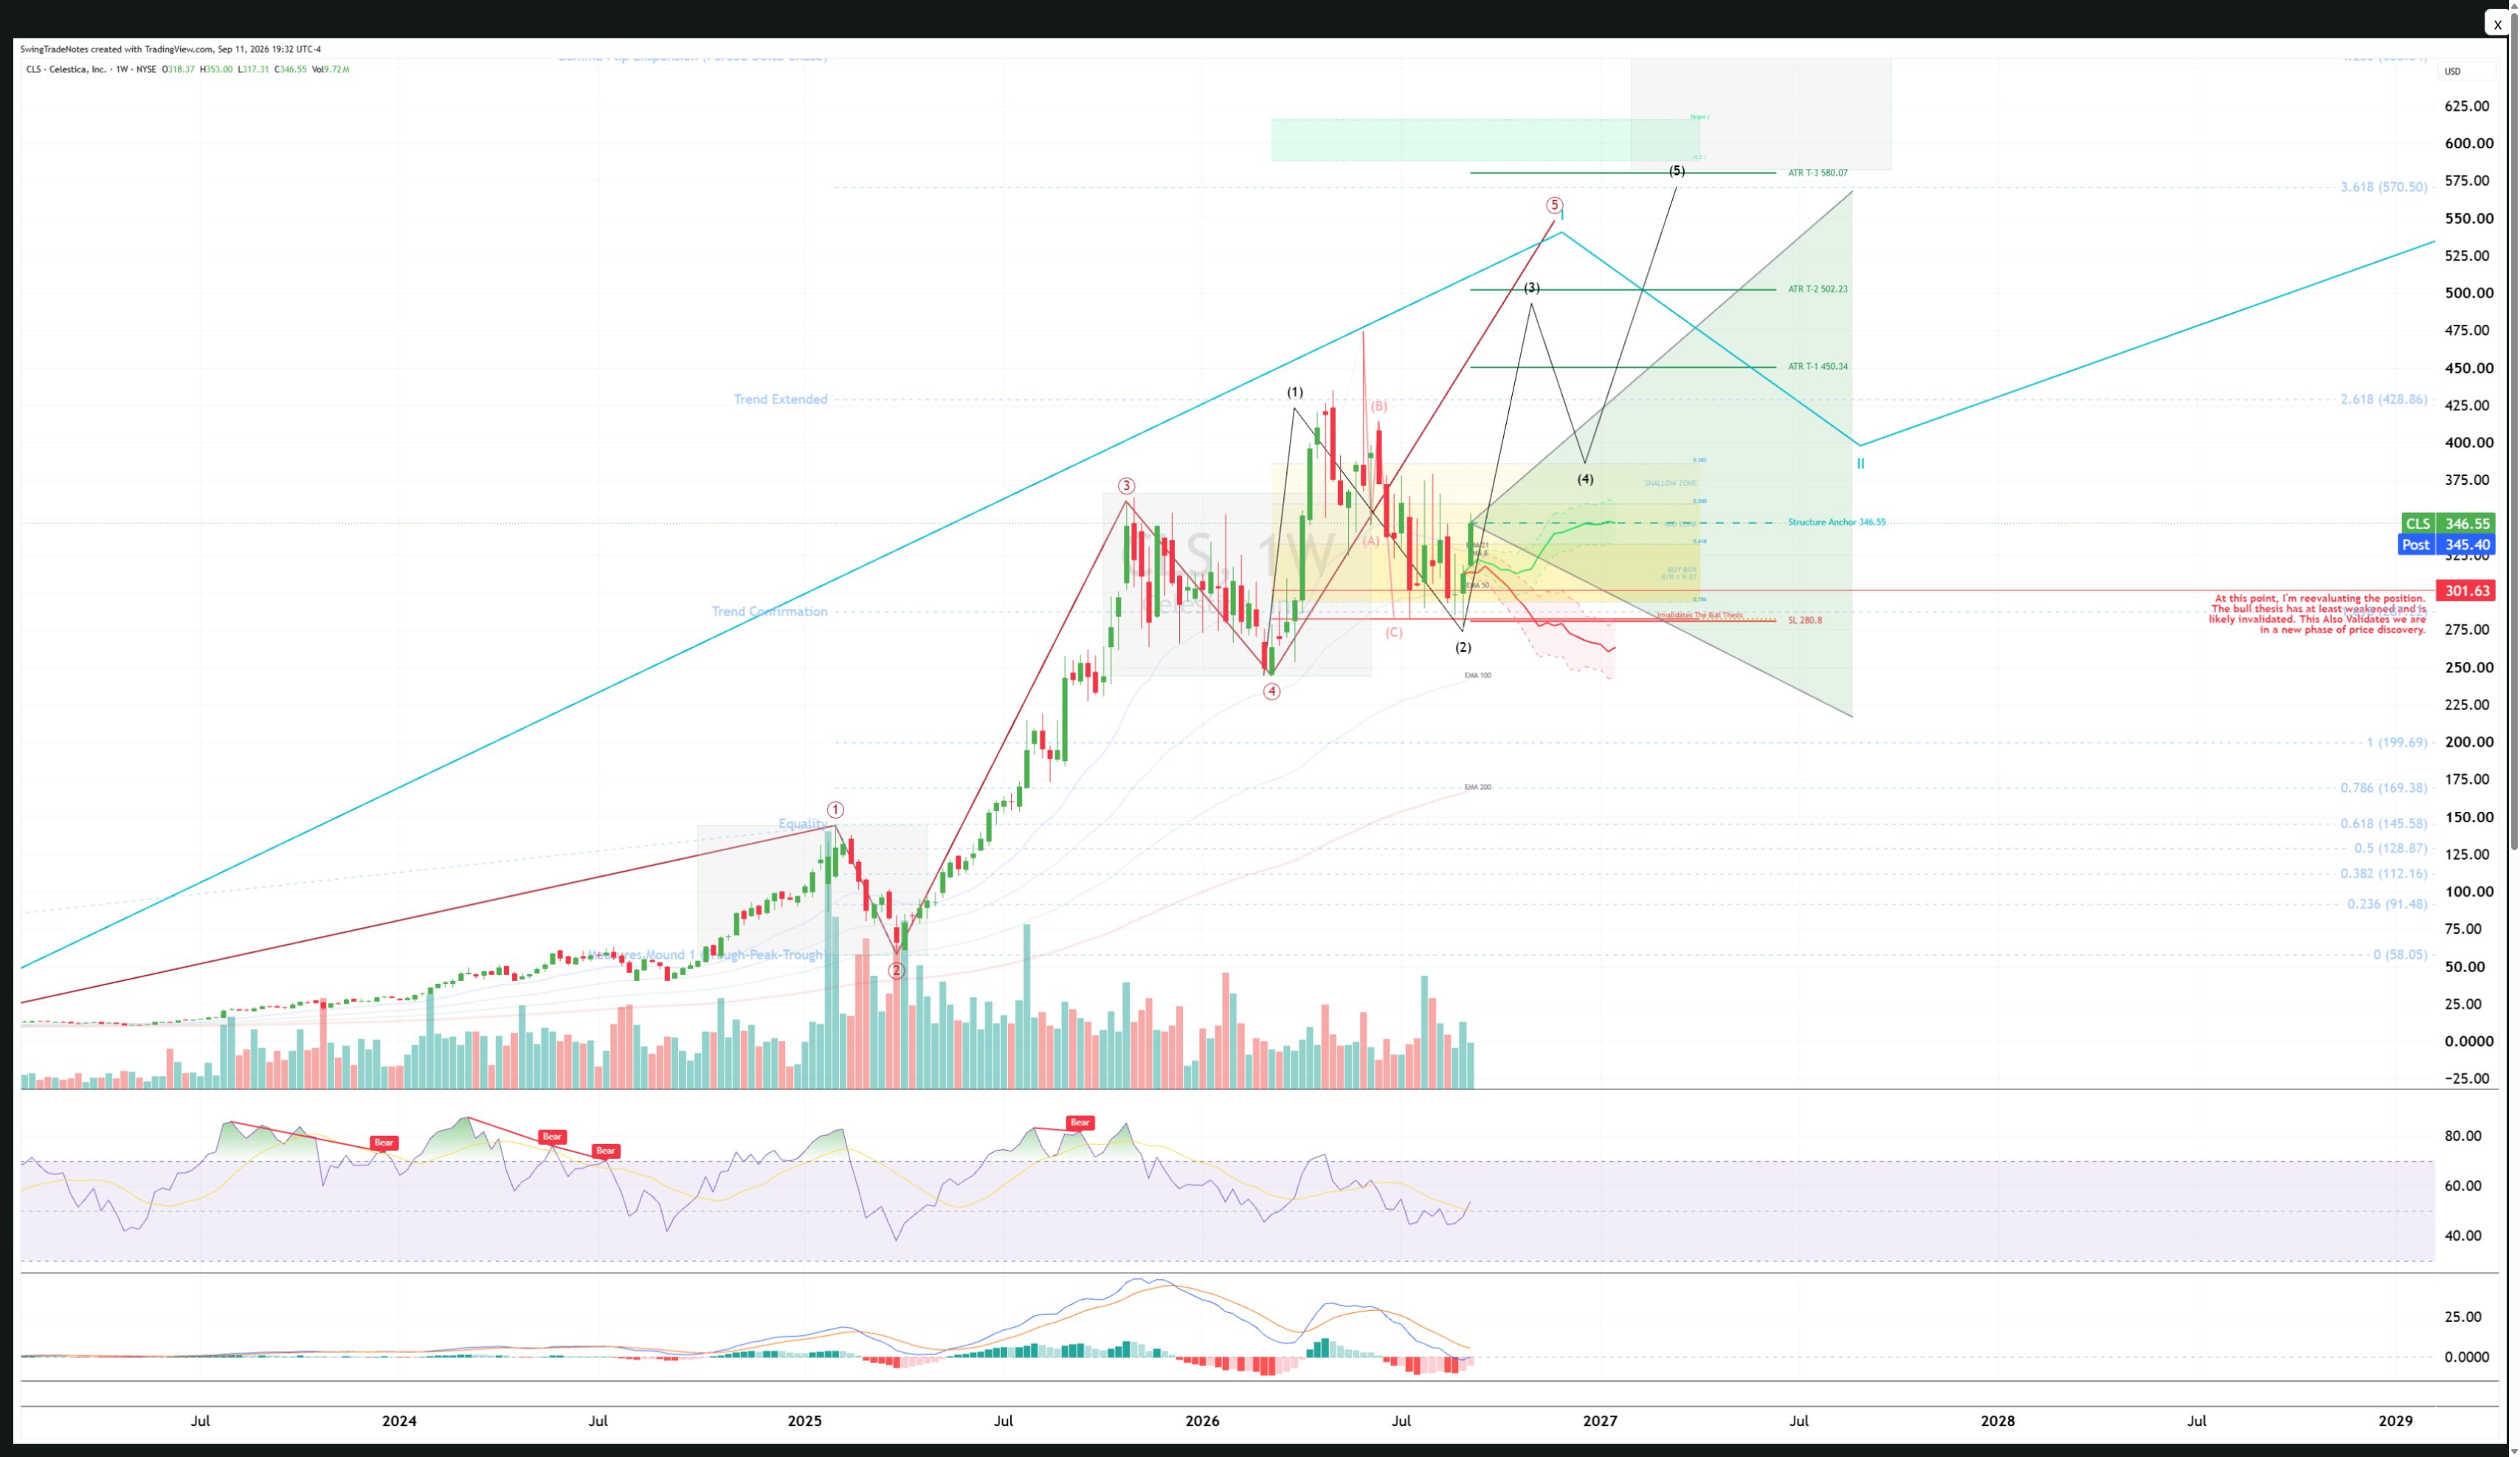
The Complete Technical Story
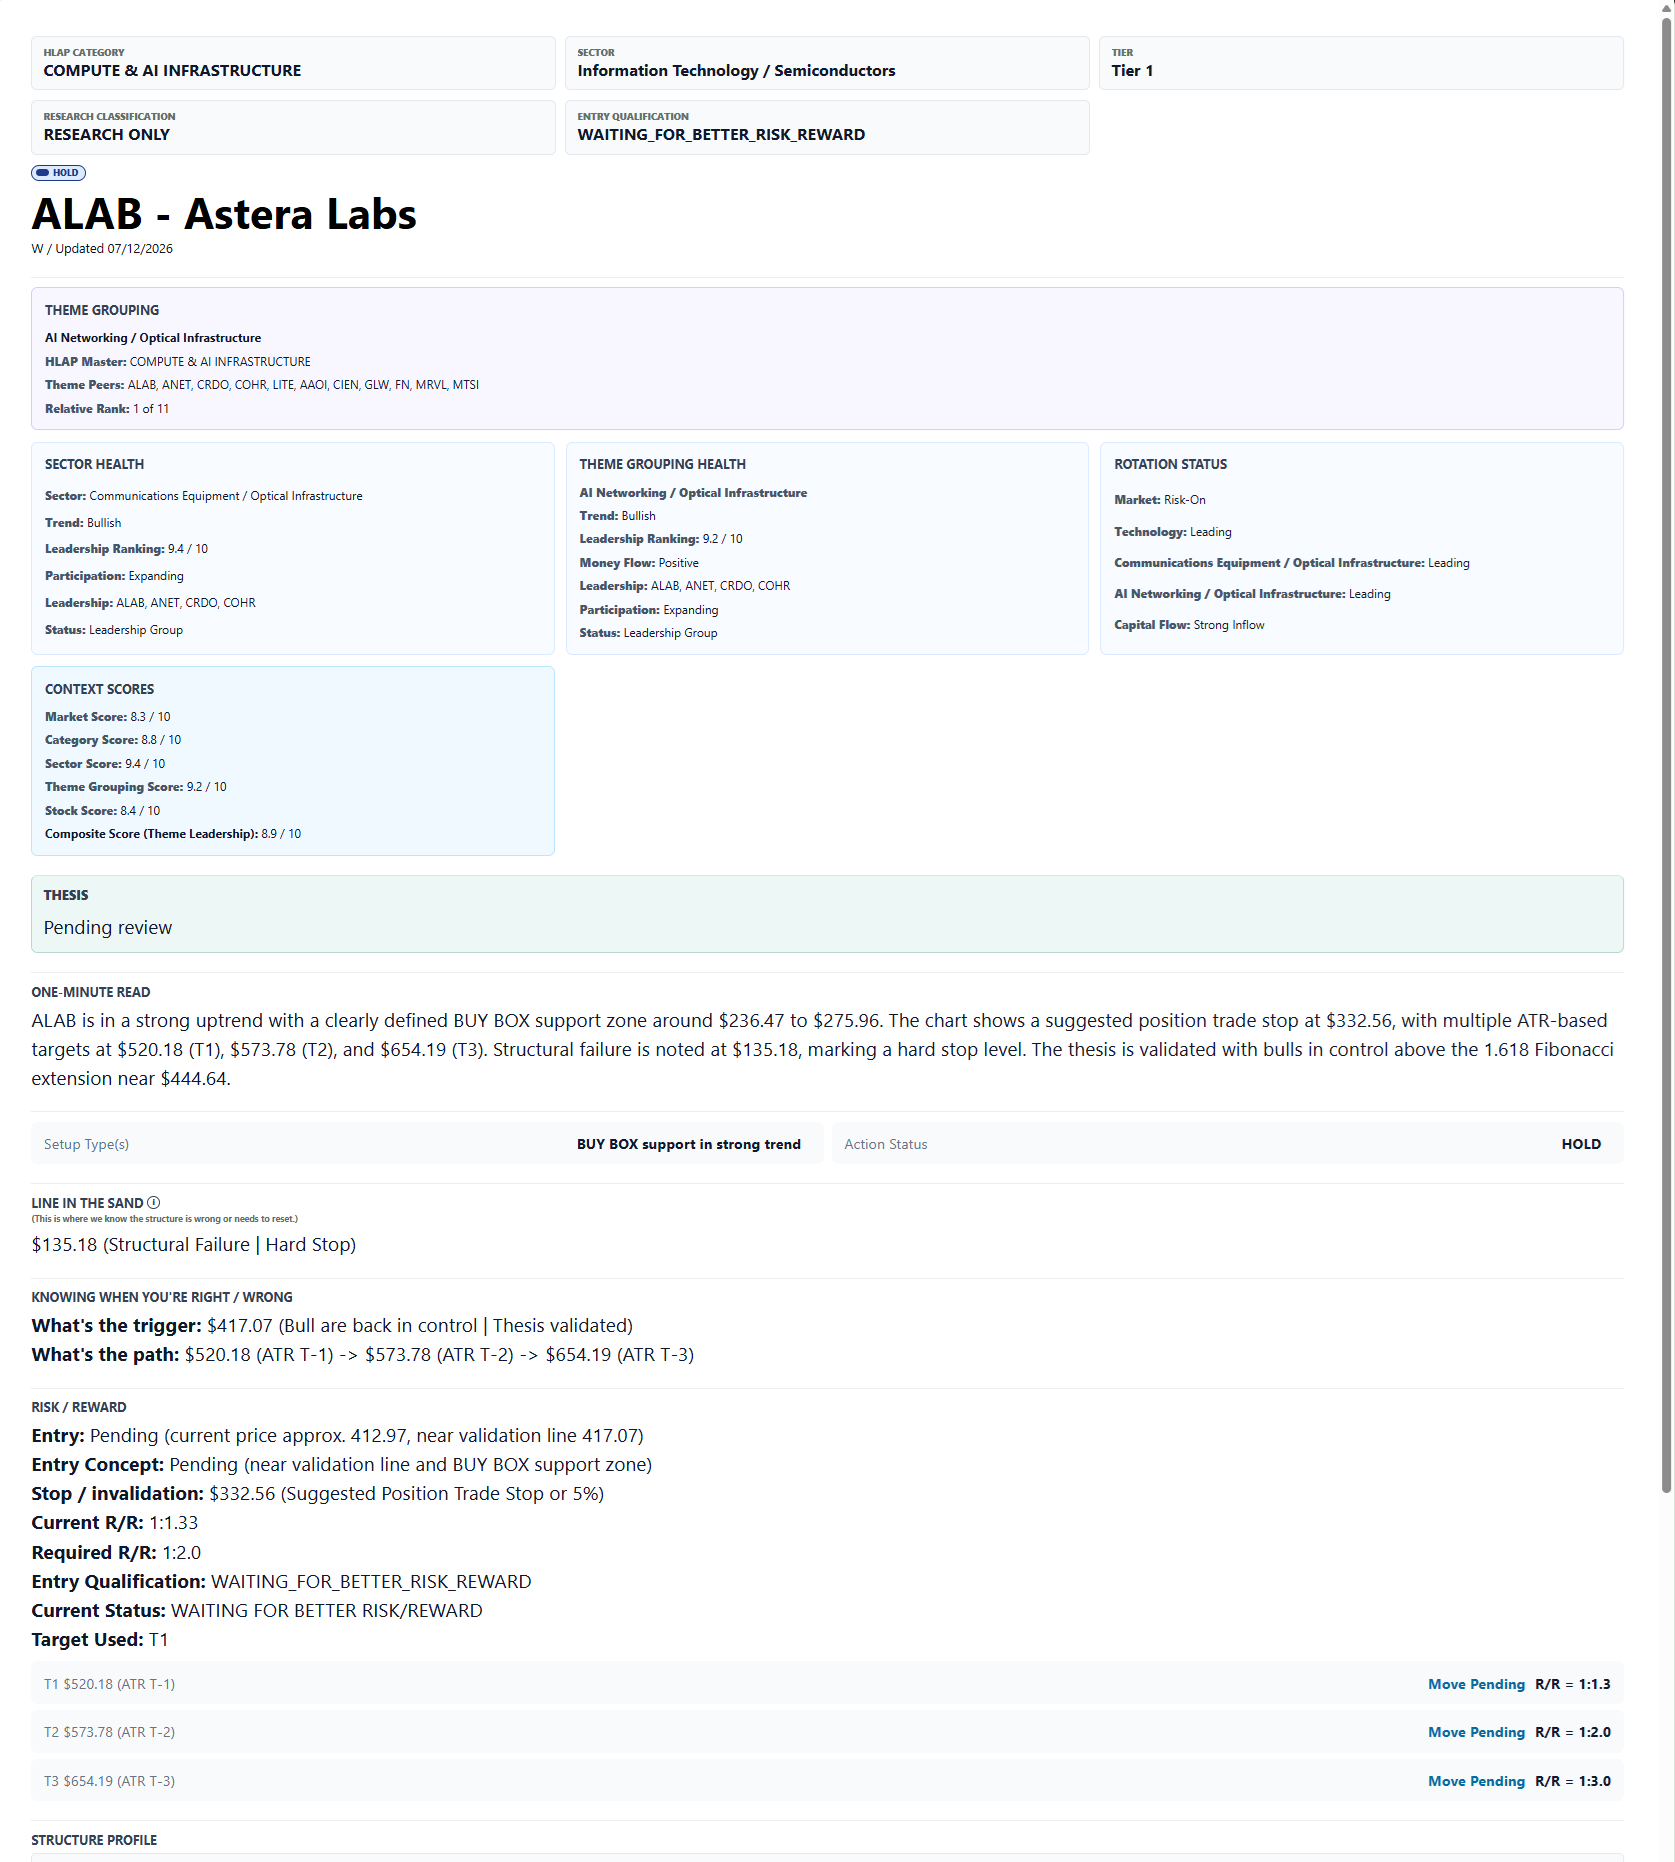
Select an image once to open the full research view.
The price study appears beside the analysis. Read the opportunity in the order below.
One-Minute Read
Begin with the short summary.
It tells you what is happening now and whether the opportunity deserves a deeper review.
Technical Structure
Technical Structure establishes the foundation for every investment decision.
It shows how price is behaving around important highs, lows, support, resistance, and the current pattern. From this foundation, you can judge whether the setup is advancing, repairing, consolidating, reclaiming, or failing.
Momentum
Momentum measures the strength behind price movement.
It helps confirm a healthy move and often provides an early warning when conditions begin changing.
Evidence
Evidence keeps conclusions grounded in measurable market behavior rather than opinion.
Relative strength, volume, technical events, and market context help show whether the market is confirming the interpretation.
Trigger
The trigger separates interesting ideas from actionable opportunities.
It defines the confirmation price must provide before the planned entry becomes relevant.
Buy Box
The Buy Box focuses attention on the area where entry risk becomes easier to define relative to the upside.
Combine the location with the trigger and Risk Ladder to judge the complete setup.
Risk Ladder
Read every risk level before looking at the targets.
The ladder shows how confidence changes as price moves away from the original plan.
Risk / Reward
Compare the planned loss with the realistic upside.
This turns an attractive story into a measurable decision.
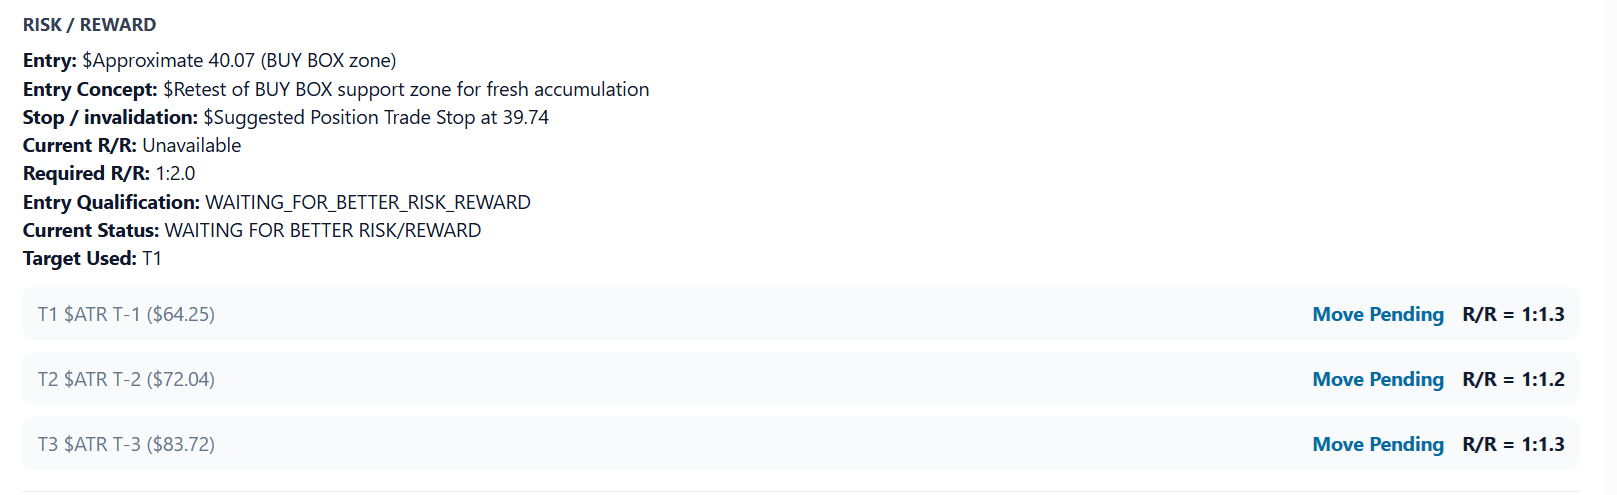
Targets
T-1, T-2, and T-3 outline the path price may follow when the setup works.
Thesis
Finish with the company story.
Reading the Thesis last lets the technical evidence stand on its own before business conviction enters the decision.
Understanding the Risk Ladder
Understanding the Risk Ladder
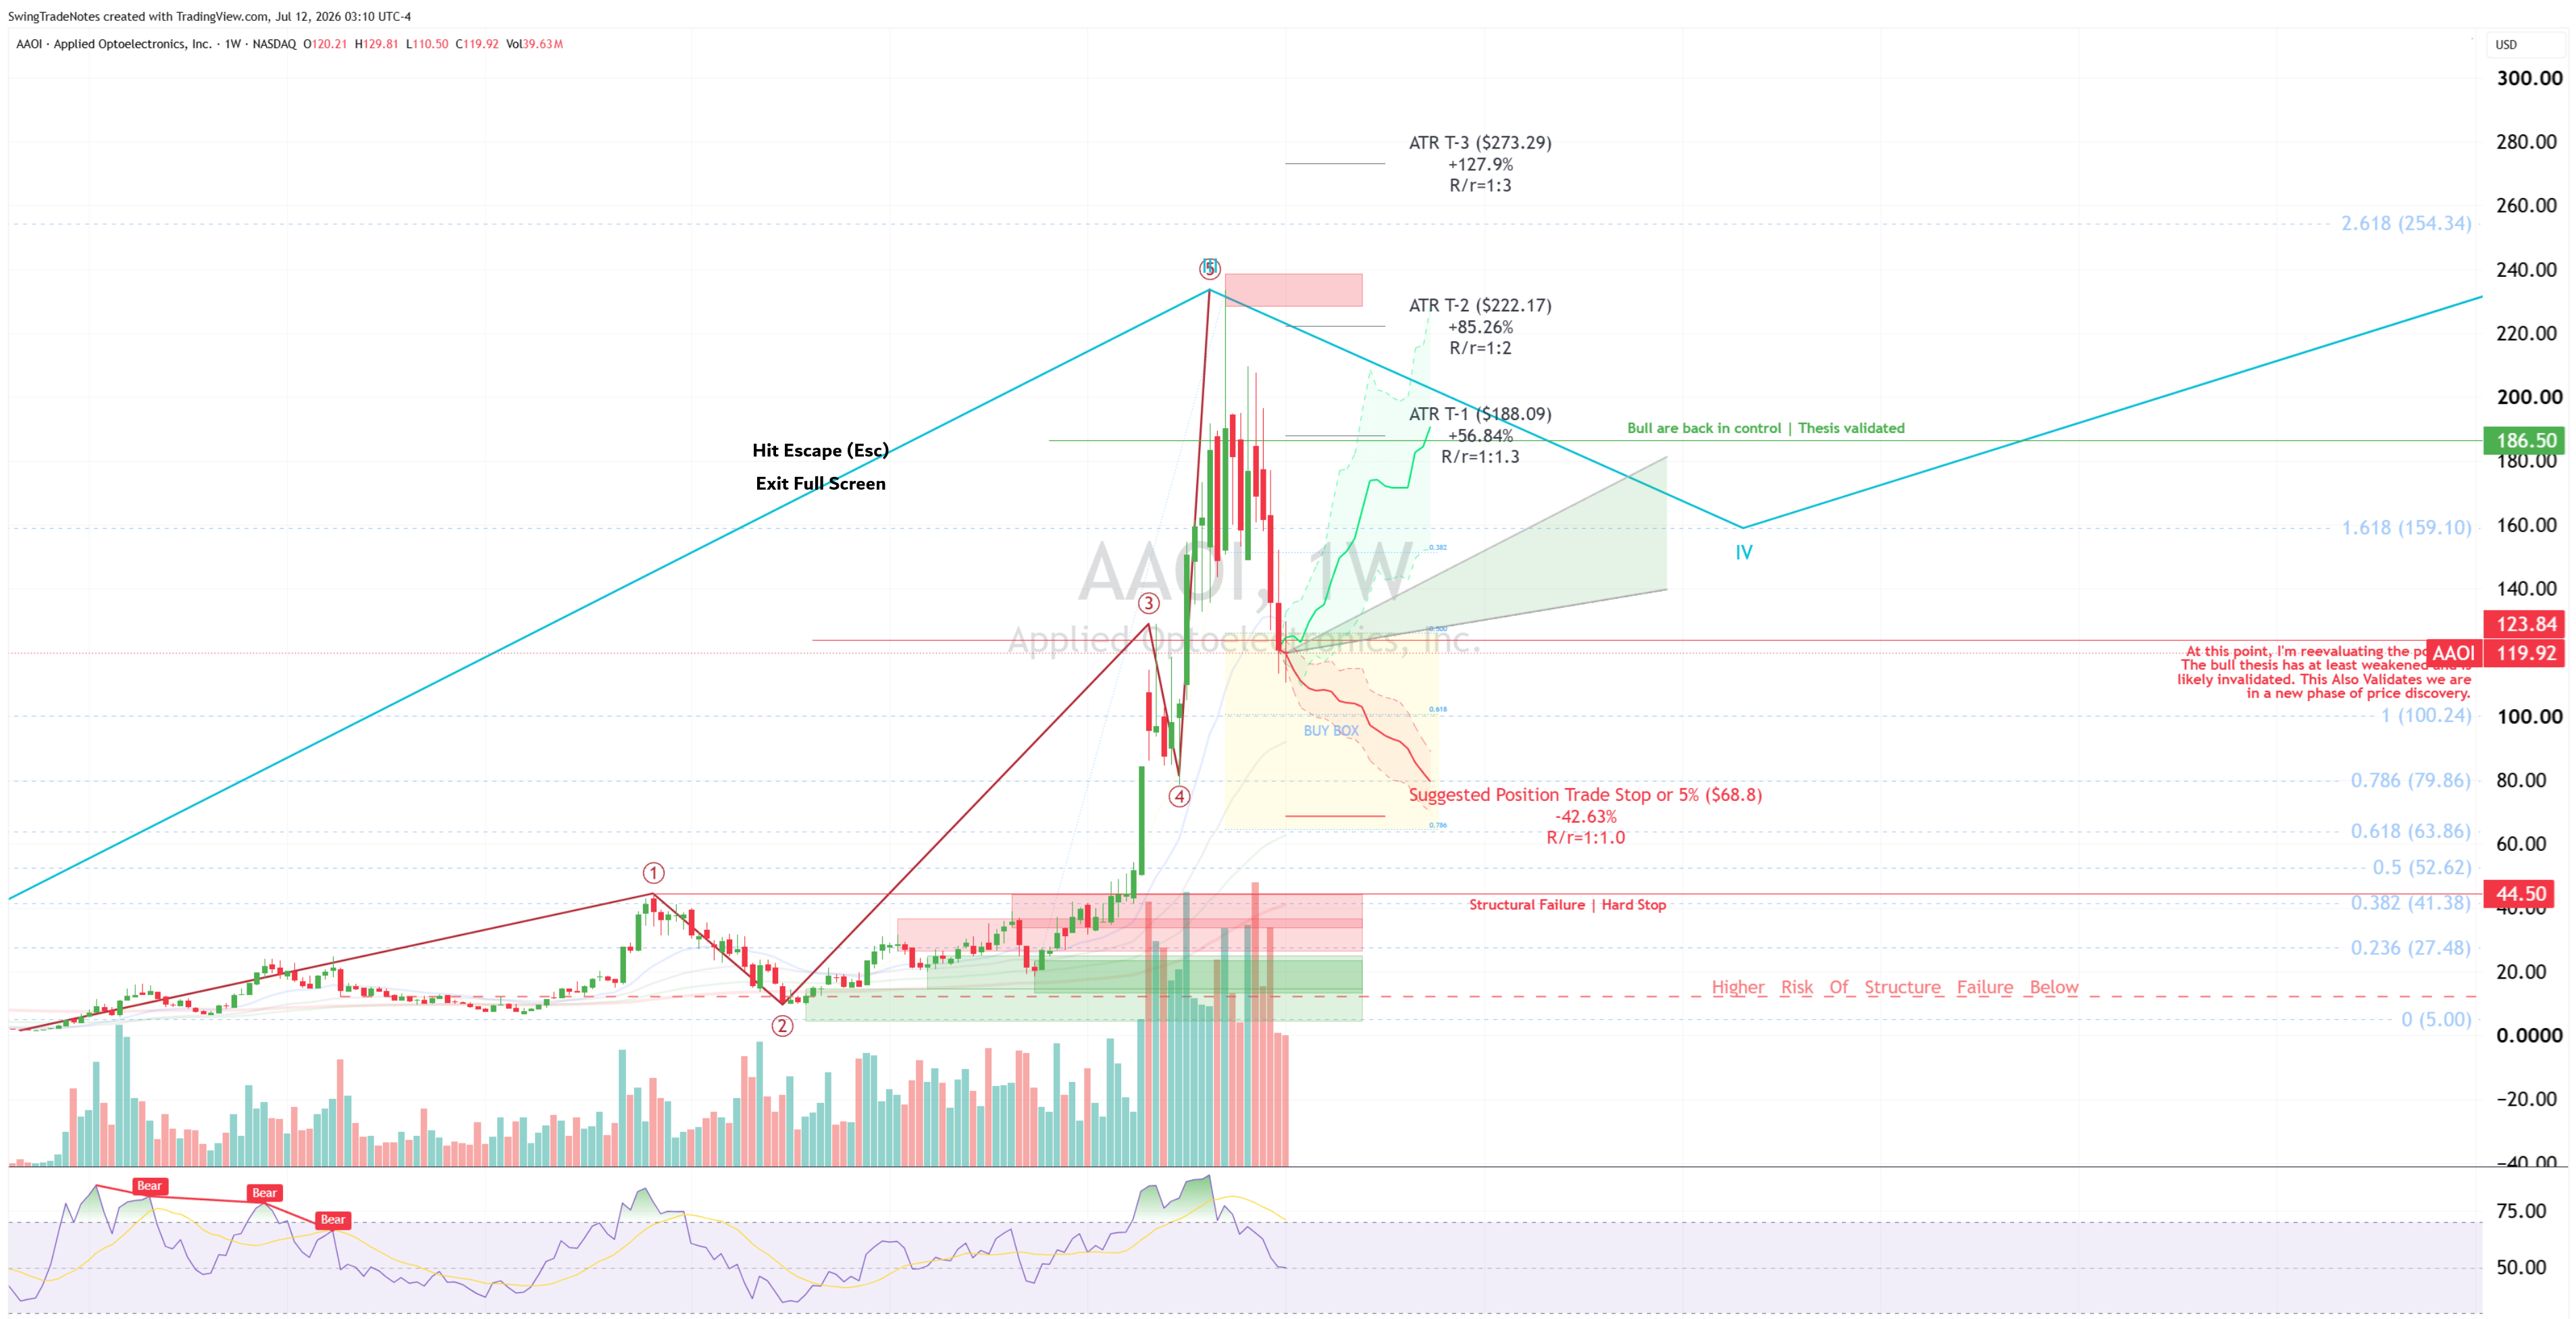
Risk develops in stages.
Every level lower on the ladder represents additional technical damage and less confidence in the original thesis.
Buy Box
The Buy Box is the preferred decision area.
Price is close enough to meaningful support that the planned risk can be compared clearly with the projected reward.
Suggested Stop
The Suggested Stop is derived using Average True Range (ATR) and therefore tends to be liberal while remaining structurally accurate.
I encourage you to review Risk Management & Position Sizing on Substack.
Structure Weakens Below
Below this level, the setup is no longer behaving as expected.
Confidence decreases, and the evidence deserves a fresh review before the original path is trusted.
Invalidation
Invalidation means a central assumption behind the setup has failed.
The original path and targets lose authority. The opportunity now requires new evidence.
Hard Stop
The Hard Stop represents complete technical failure.
At this point, the original thesis should no longer guide the decision. Price is often entering a larger corrective phase that calls for a new analysis rather than simply adjusting expectations.
Understanding the full ladder before entry makes each later decision clearer, calmer, and more consistent.
Understanding Risk vs Reward
Risk/reward compares the amount planned for loss with the amount available if price reaches its objective.
Great investors don't simply look for large gains. They look for situations where the potential reward is significantly larger than the planned risk.
What 1:1 means
If you risk $1 to make $1, the risk/reward is 1:1.
- Risk: $1
- Potential reward: $1
- Risk/reward: 1:1
This offers little margin for missed targets, imperfect timing, or normal trading costs. One full loss offsets one full gain.
What stronger ratios mean
At 1:2, you risk $1 for a potential $2 gain.
At 1:3, you risk $1 for a potential $3 gain.
At 1:5, you risk $1 for a potential $5 gain.
The larger ratio improves the potential payoff relative to the planned loss. The target remains an objective rather than a guarantee.
CHART BOOK screening rules
Minimum ratios help reserve the highest-conviction collections for opportunities with enough potential reward:
| Research group | Minimum risk/reward |
|---|---|
| General Actionable Charts | 1:2 |
| Starter Suggested | 1:2.5 |
| Top Picks | 1:3 |
Opportunities below these levels remain part of the research library. A better entry, tighter risk boundary, or stronger target path can improve the ratio later.
Understanding Technical Targets
Targets create a roadmap for measuring progress when the setup behaves correctly.
T-1
T-1 is the first realistic objective.
It often marks the nearest meaningful resistance level or technical projection.
T-2
T-2 is the second objective.
Reaching it provides stronger evidence that the trend is continuing beyond the first move.
T-3
T-3 is the extended objective.
It represents the largest current projection and generally requires the strongest continuation.
Targets are probabilities rather than promises. Use them to measure progress, reassess risk, and compare the remaining upside with changing conditions.
Publisher Language Standard
Methodology: ATR Price Projections are mechanically calculated from the model's volatility framework. Technical Invalidation identifies the level at which the current technical thesis no longer satisfies the model's criteria. Re-evaluation Levels identify conditions warranting reassessment of the technical thesis. These levels are general and impersonal research outputs and are not individualized investment advice.
When a projection is derived from another methodology, it is labeled according to its source, such as Technical Price Projection, Fibonacci Projection, or Elliott Wave Projection.
Technical research. General and impersonal analysis. Technical levels and model-derived projections are analytical reference levels, not guaranteed outcomes. Not individualized investment advice.
Understanding Technical Targets
Understanding the Thesis
The technical picture explains: What is price doing?
The Thesis explains: Why does this company deserve attention?
The research may include:
- The business and how it creates value
- The industry it competes in
- Important catalysts
- Its competitive position
- Market themes supporting demand
- The long-term outlook
The Thesis develops conviction in the company. Technical structure brings discipline to timing.
Moving Through Charts Quickly
Step 1Open a Chart from the Directory
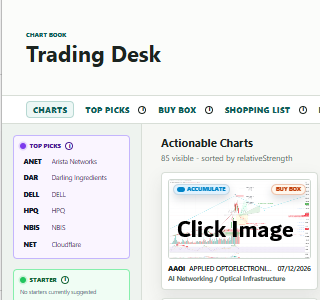
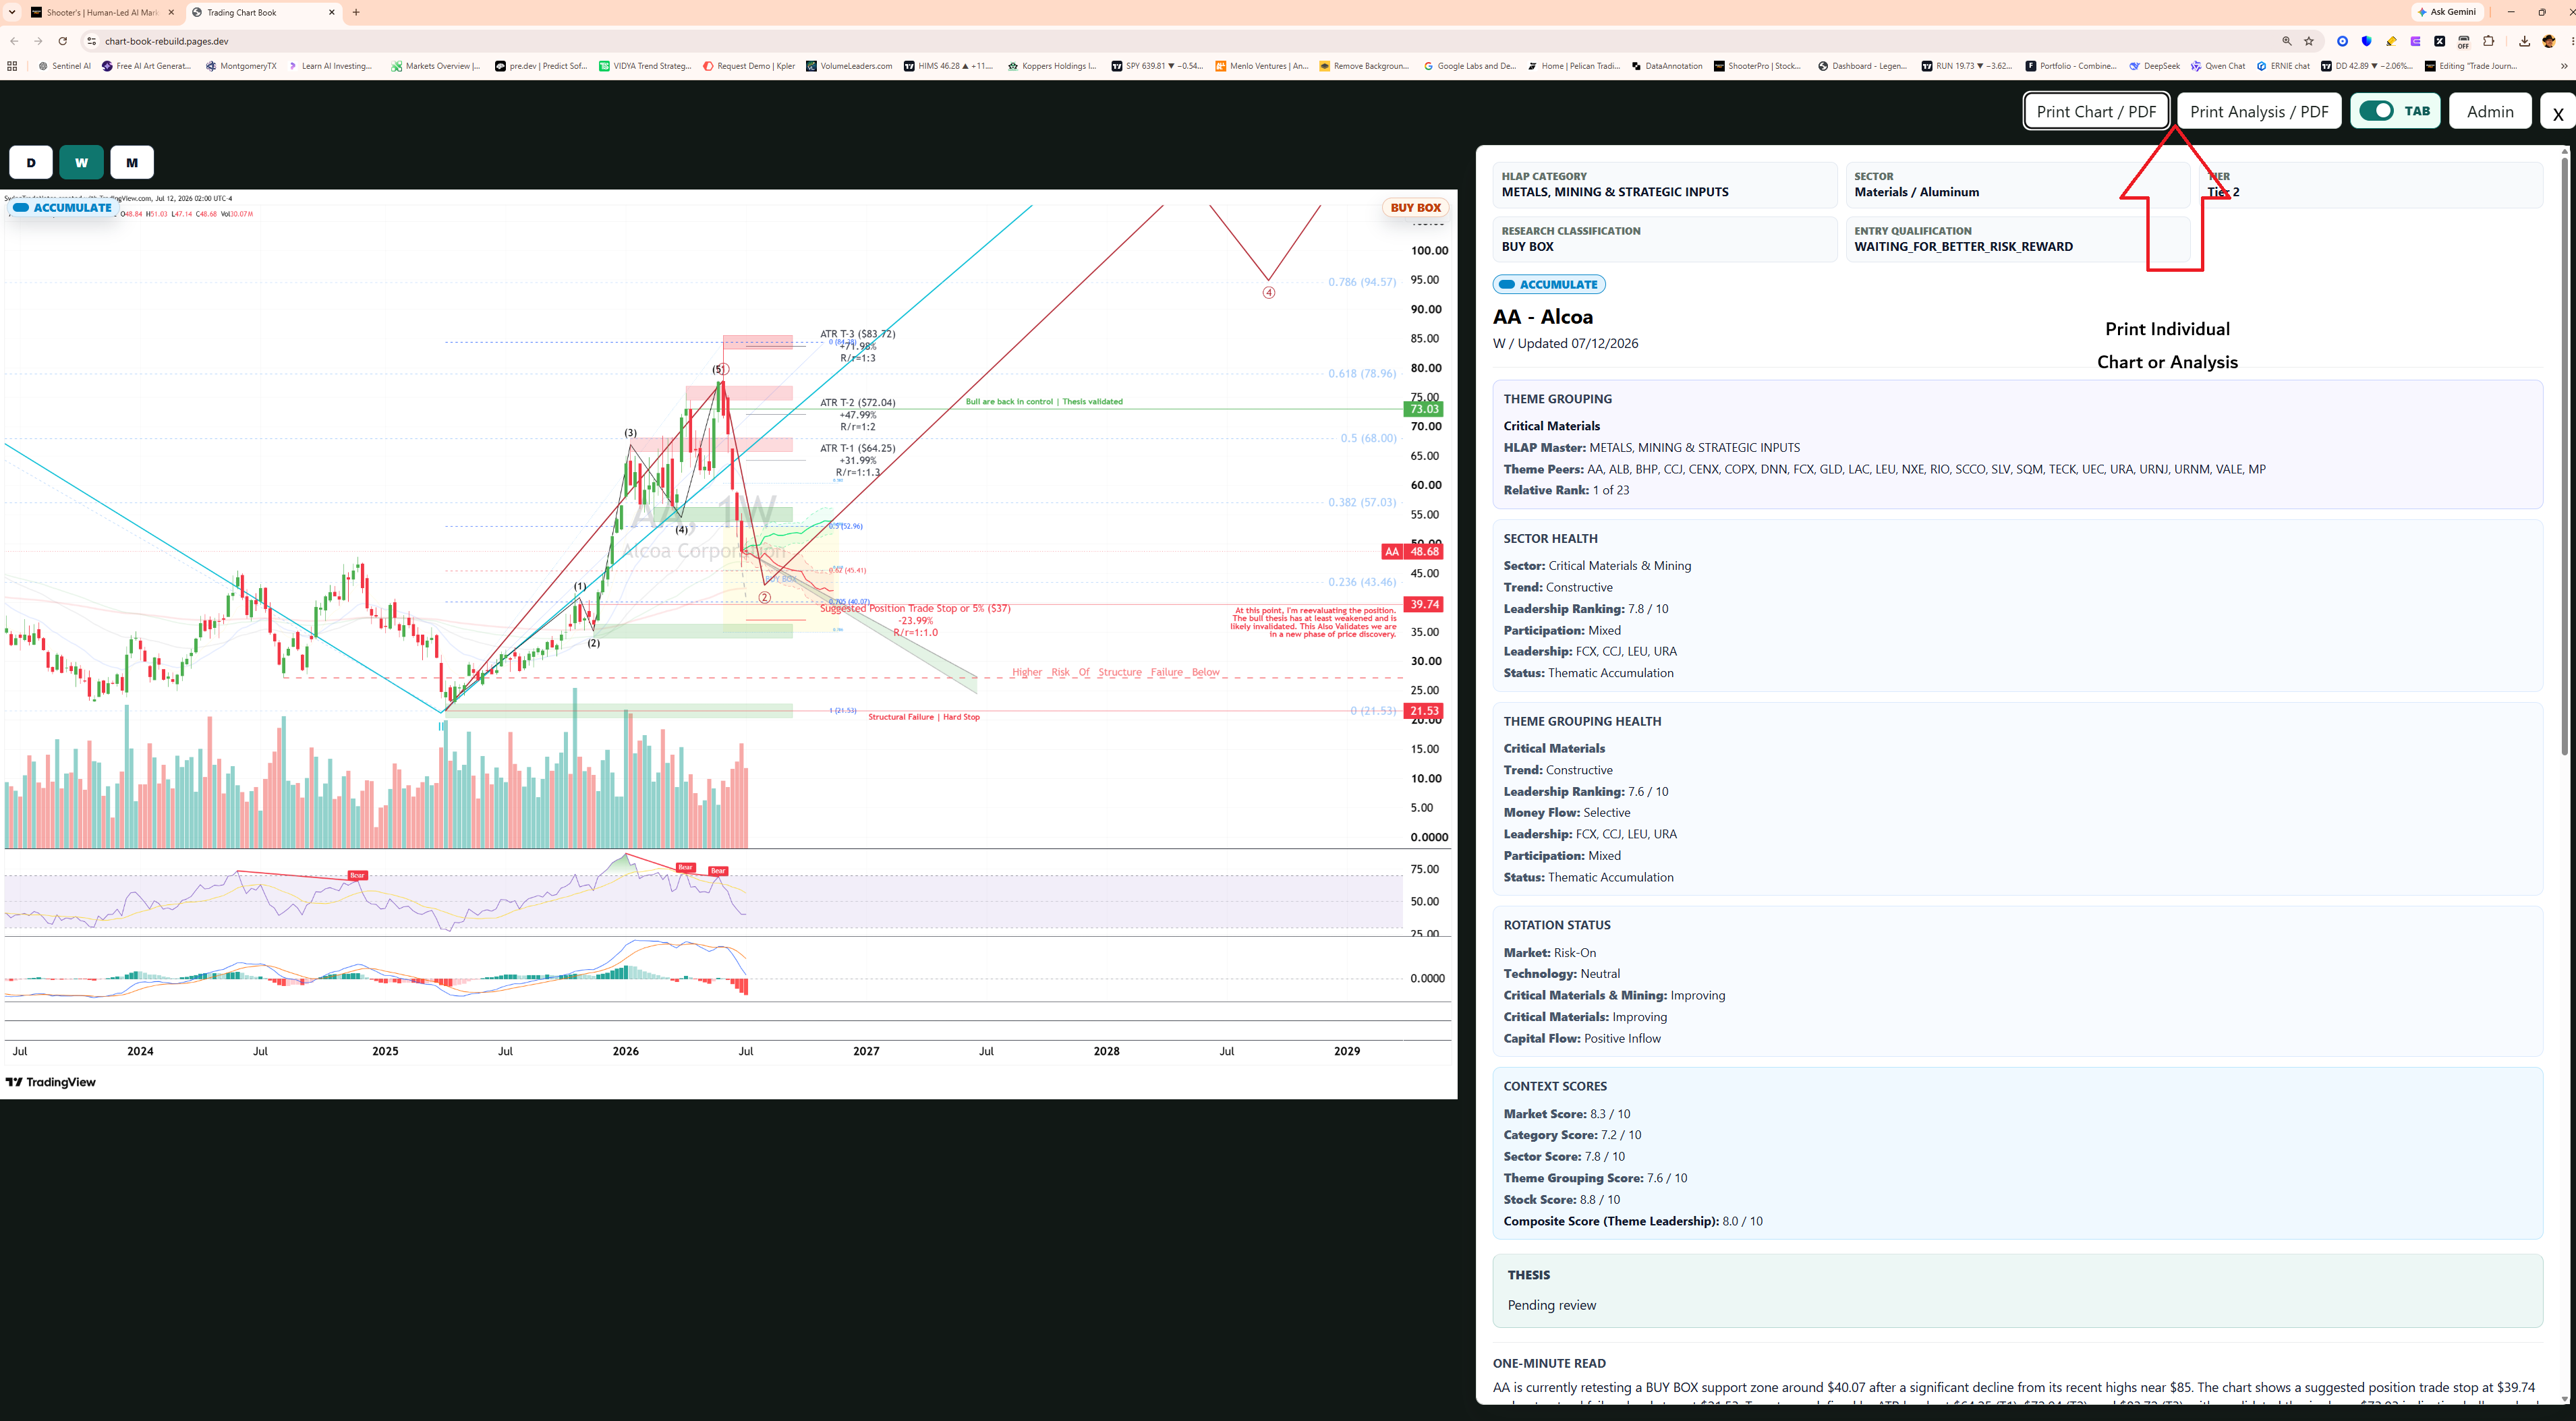
Open the Chart or Analysis Full Screen
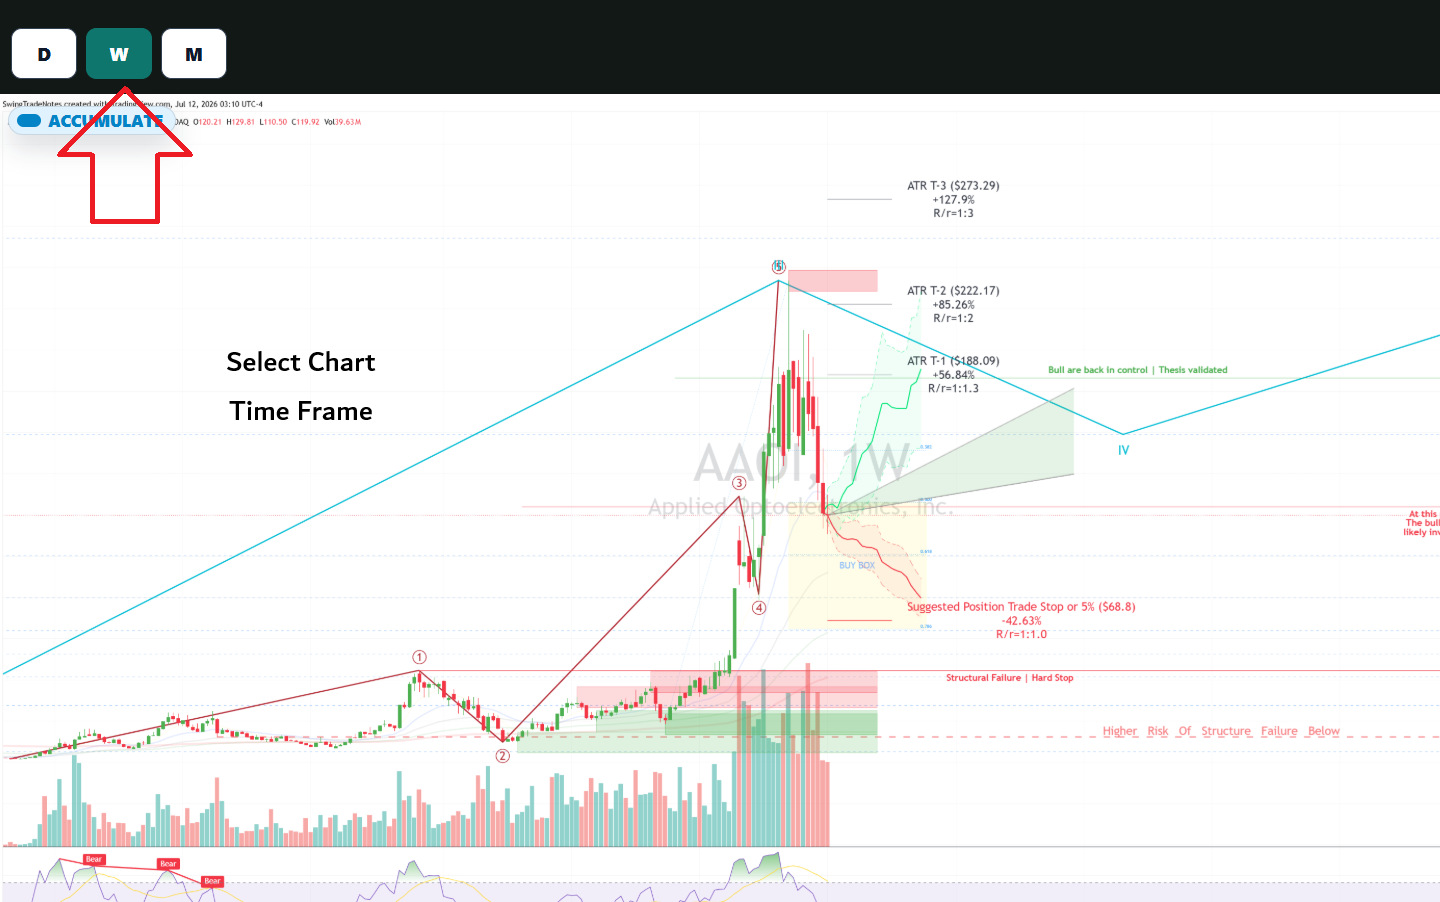
How to Select Different Time Frames
Research speed matters when the opportunity set is large.
CHART BOOK lets you review hundreds of ideas without returning to the directory after each one.
POP-OUT NAVIGATION — NEXT: After opening a chart in the pop-out view, press Down Arrow, or turn on Tab navigation and press Tab, to advance to the next chart.
POP-OUT NAVIGATION — PREVIOUS: While the pop-out remains open, press Up Arrow, or press Shift+Tab, to return to the previous chart.
IMPORTANT: Tab and the Arrow keys work only inside the open chart pop-out. They do not navigate charts from the directory or Carousel View.
The review continues through the collection or filtered group you opened, keeping your original purpose intact.
Use D, W, and M to compare available Daily, Weekly, and Monthly views for the same company.
Select the large price image to study it by itself. Select a clear area of the analysis to focus on the written research.
The Mound Base reference card is different from a chart record: its full-screen view is educational, and closing it returns directly to the directory rather than opening an empty chart or analysis shell.
CLOSE THE OPEN SCREEN — ESCAPE (Esc): Press Escape (Esc) to close the full-screen chart or analysis and return to the combined view. Press Escape (Esc) again to close the combined view and return to the chart directory.
Finding Charts Fast
As your research library grows, quickly finding the right opportunity becomes just as important as analyzing it.
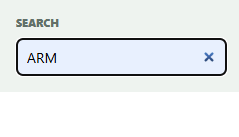
Enter a ticker, company name, theme, or sector. Results update instantly as you type.
Ticker search takes you directly to a known symbol. Company search helps when the symbol is less familiar. Theme and sector searches reveal related opportunities across the library.
Finding Charts Fast
Narrowing the Market
Narrowing Your Research
Professional investors narrow the opportunity set so their attention stays on the most relevant evidence.
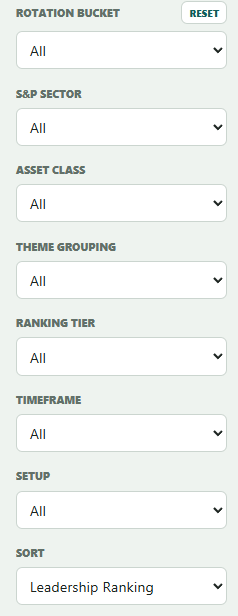
Filters turn a broad market into a focused research session:
- Action Rating focuses on the current research state.
- Rotation Bucket focuses on where market leadership and money are moving.
- S&P Sector focuses on a broad part of the economy.
- Asset Class groups stocks, funds, indexes, and other investments.
- Theme Grouping focuses on a shared investment idea.
- Ranking Tier focuses on leadership quality.
- Timeframe focuses on the period under review.
- Setup focuses on a particular technical pattern.
Each choice works with the others to create a more precise list.
RESET: Select Reset to clear the current search and filter criteria and begin a new review.
Narrowing the Market
Organizing Your Research
Research
Sorting changes your perspective—not your research.
Choose the order that fits the question:
- Priority creates the normal daily review order.
- Ticker creates an alphabetical directory.
- S&P Sector places comparable companies together.
- Last Updated brings the freshest work forward.
- Composite Score compares overall theme leadership.
The underlying rating stays the same. Only your point of view changes.
Exporting Your Research
Saving the work creates a durable record for deeper review, discussion, or future comparison.
Use Print / PDF above the directory to export the collection or filtered list currently on screen.
Open one opportunity for a focused export.
Use Print Chart / PDF to save the full price study on an 11 x 8-inch landscape page.
Use Print Analysis / PDF to save the written research on 8 x 14-inch portrait pages. Longer work continues onto the next page so the complete analysis remains together.
Choose Save as PDF in the browser's print window to save the file to your computer.
Exporting Your Research
Using CHART BOOK Anywhere
Mobile ViewUsing CHART BOOK Anywhere
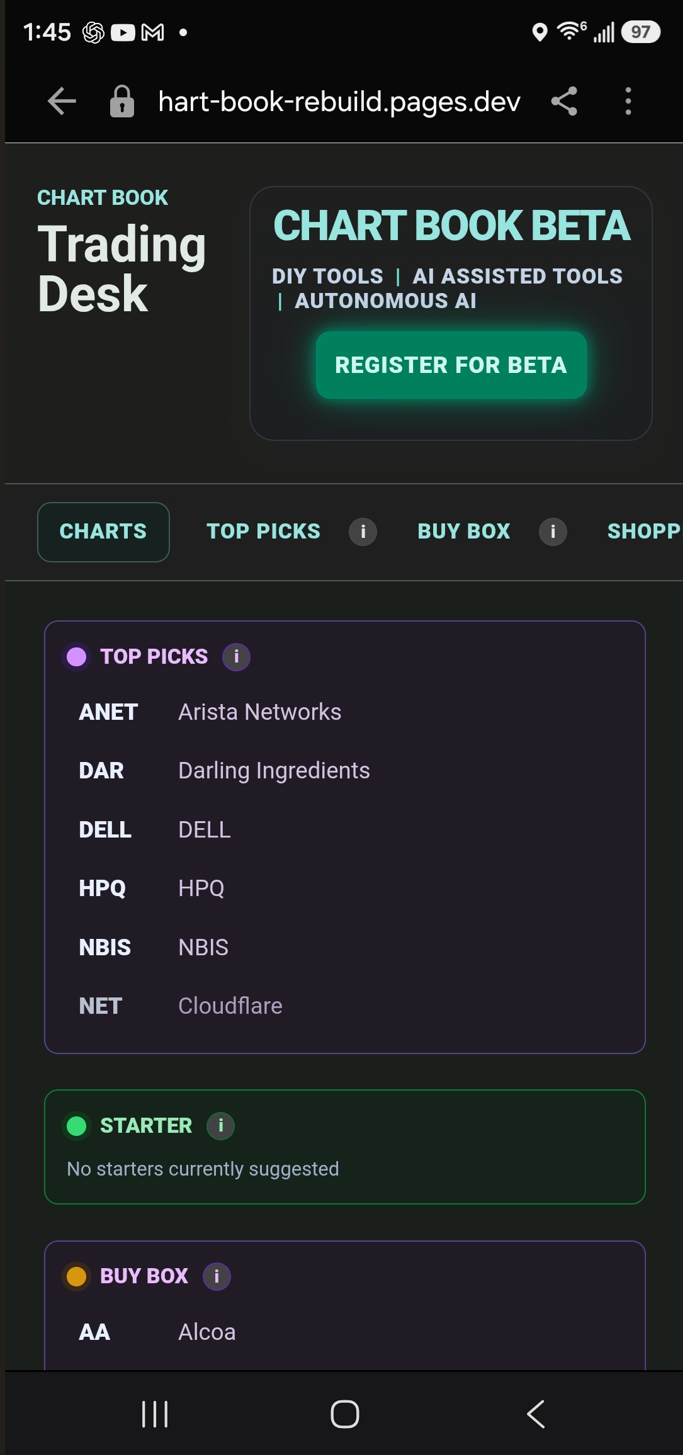
Mobile AccessScan to Open CHART BOOK

Your research process remains consistent when you move from a desk to a smaller screen.
Tap an image to open the complete research view. Tap the price study again to focus on it, or tap a clear area of the analysis to focus on the written work.
Timeframe, search, filter, and close controls remain available in the compact layout, allowing the same review to continue wherever you are.
Helpful Definitions
Every research term should be understandable at the moment it matters.
Select the small i beside a CHART BOOK term for a plain-English explanation. Select Close, click outside the explanation, or press Esc when you are ready to continue.
Privacy
PRIVACYConsent and Analytics Controls

Privacy controls explain when optional first-party analytics are allowed, what the system records, and what it excludes. Analytics are not sent before consent. Essential-only mode keeps the research desk usable without sending activity events, and the Privacy page provides withdrawal and deletion controls.
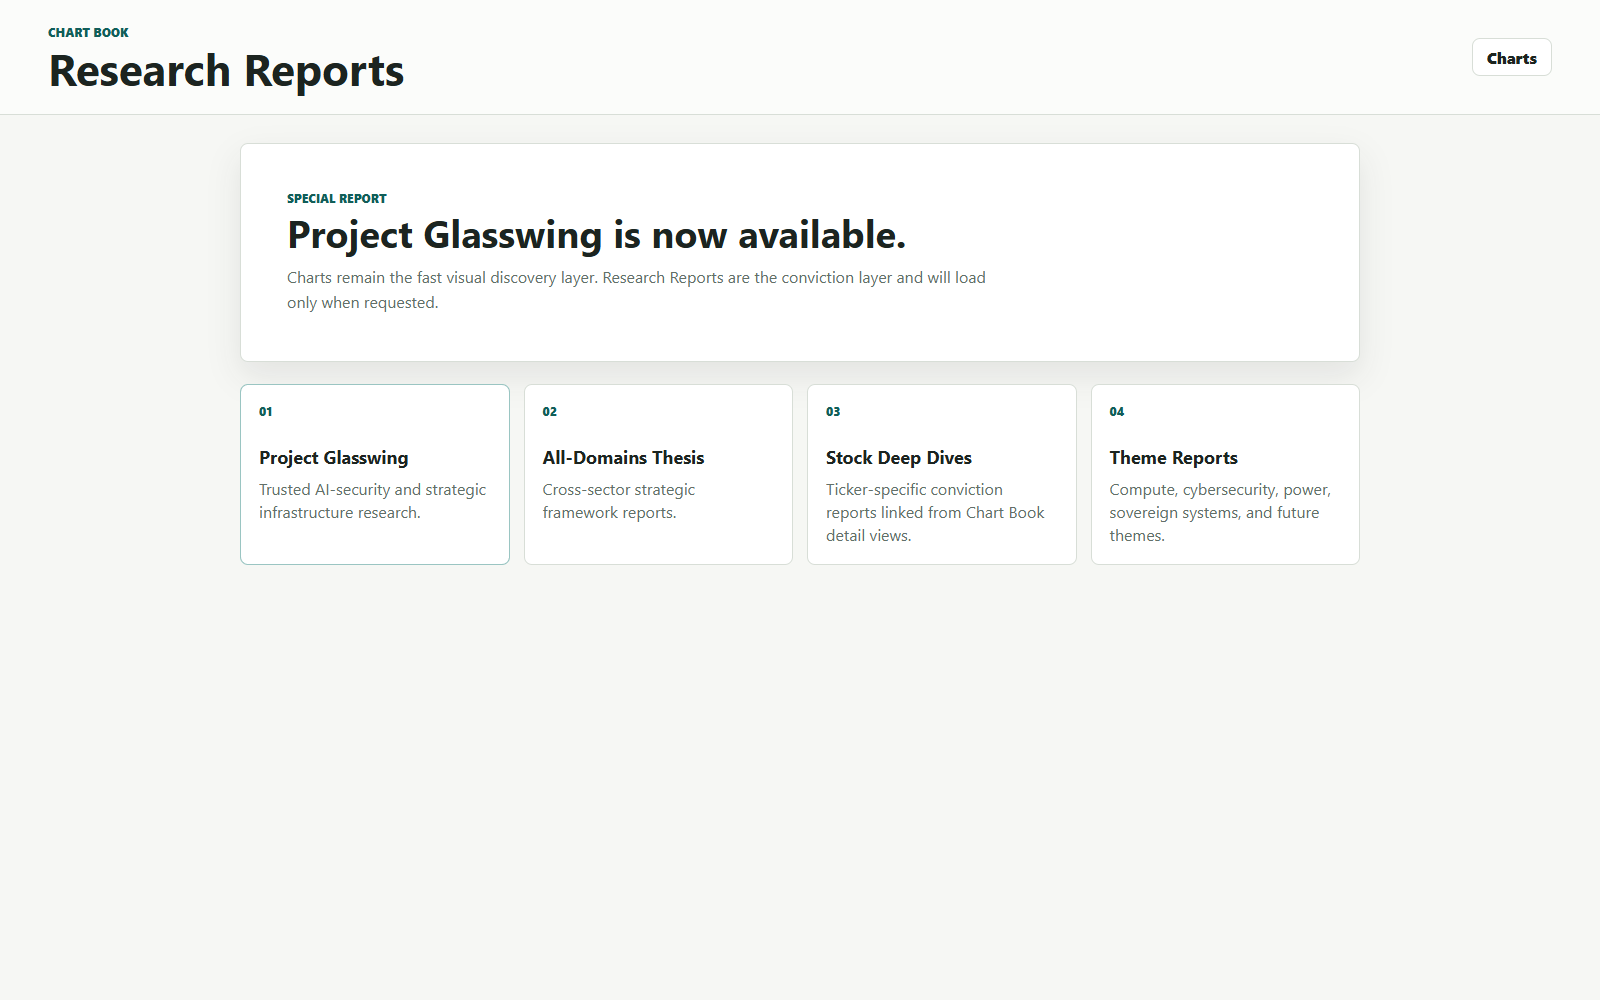
Research
Research provides the longer story behind a company or market theme.
Use them to connect business quality, industry change, competitive position, and long-term catalysts with the technical opportunity. Select Charts to return to the research desk.
Research performance rows
Research & Deep Dives now show two delayed performance percentages when a defined ticker and baseline are available:
- Now is the percentage change from the pre-publication baseline to the latest completed market close.
- Max is the highest percentage gain reached after publication, measured from that same baseline.
Green indicates a positive change and red indicates a negative change. These rows are descriptive performance history, not a promise that the article caused the move or that the result can be repeated. The values are intentionally delayed and use completed market data so the Research page does not make a live quote request or slow ChartBook down.
Alerts
Current WorkspaceALERTS
Alerts are a monitoring surface for technical events. Use an alert to identify a chart that deserves review, then return to the full chart and analysis before drawing a conclusion. An alert is a prompt to investigate, not a broker instruction or an automatic trade.
Beta Access
Register for Beta to receive early access to new CHART BOOK capabilities as they become available.
Choose the areas that interest you and enter the requested contact information. Text-message consent is optional.
Remember These Five Principles
- Research before emotion.
- Understand the risk before considering the reward.
- Wait for confirmation before acting.
- Great companies still require disciplined entry points.
- CHART BOOK organizes the research. You remain responsible for every investment decision.